Quantitative betting differs fundamentally from intuition-driven tipping.
It follows a structured workflow: identify value, construct portfolios, assess risk.
This post illustrates how a data-driven bettor approaches Matchday 12 — calm, systematic, evidence-based.
Key messages
Portfolios win — not individual bets.
The visualisations below highlight the core insights:
- Value is the starting point, not the decision.
- Equal Weight is inefficient; Max Return is overly concentrated.
- Optimised portfolios provide the best balance of return, risk and stability.
- Risk profiles and loss contributions become meaningful only when visualised.
Key metrics from Matchday 12:
| λ | Return | VaR(95%) | Concentration |
|---|---|---|---|
| 0.0 | 7.79 | 9.64 | 53% |
| 0.1 | 8.04 | 9.84 | 64% |
| 0.5 | 7.06 | 8.81 | 45% |
| 1.0 | 6.98 | 8.67 | 47% |
| 2.0 | 3.31 | 5.50 | 17% |
1. Value as the entry point
A bet has value when the modelled probability exceeds the implied probability of the market price.
For Matchday 12, seven bets meet this criterion and form the initial opportunity set.
| MD | Home | Away | Outcome | Odds | p(model) | EV/unit |
|---|---|---|---|---|---|---|
| 12 | Union Berlin | Heidenheim | 2 | 5.40 | 0.292 | 0.5768 |
| 12 | Leverkusen | Dortmund | 1 | 2.55 | 0.410 | 0.0455 |
| 12 | Hamburger SV | Stuttgart | 2 | 2.20 | 0.507 | 0.1154 |
| 12 | Freiburg | Mainz | 2 | 4.10 | 0.346 | 0.4186 |
| 12 | Werder Bremen | Köln | 1 | 2.25 | 0.490 | 0.1025 |
| 12 | Hoffenheim | Augsburg | X | 4.00 | 0.256 | 0.0240 |
| 12 | Hoffenheim | Augsburg | 2 | 4.35 | 0.450 | 0.9575 |
A few points stand out:
- Magnitude varies significantly: from marginal opportunities (EV ≈ 0.02) to strong mispricings such as Hoffenheim–Augsburg (2) with EV ≈ 0.96.
- Value is not a stake signal: it identifies which bets merit further analysis, not how much to allocate.
- The true decision happens on the portfolio level, after diversification and risk are considered.
2. Strategies and the efficient frontier
The following visualisation shows how different strategies behave in the return–risk space:
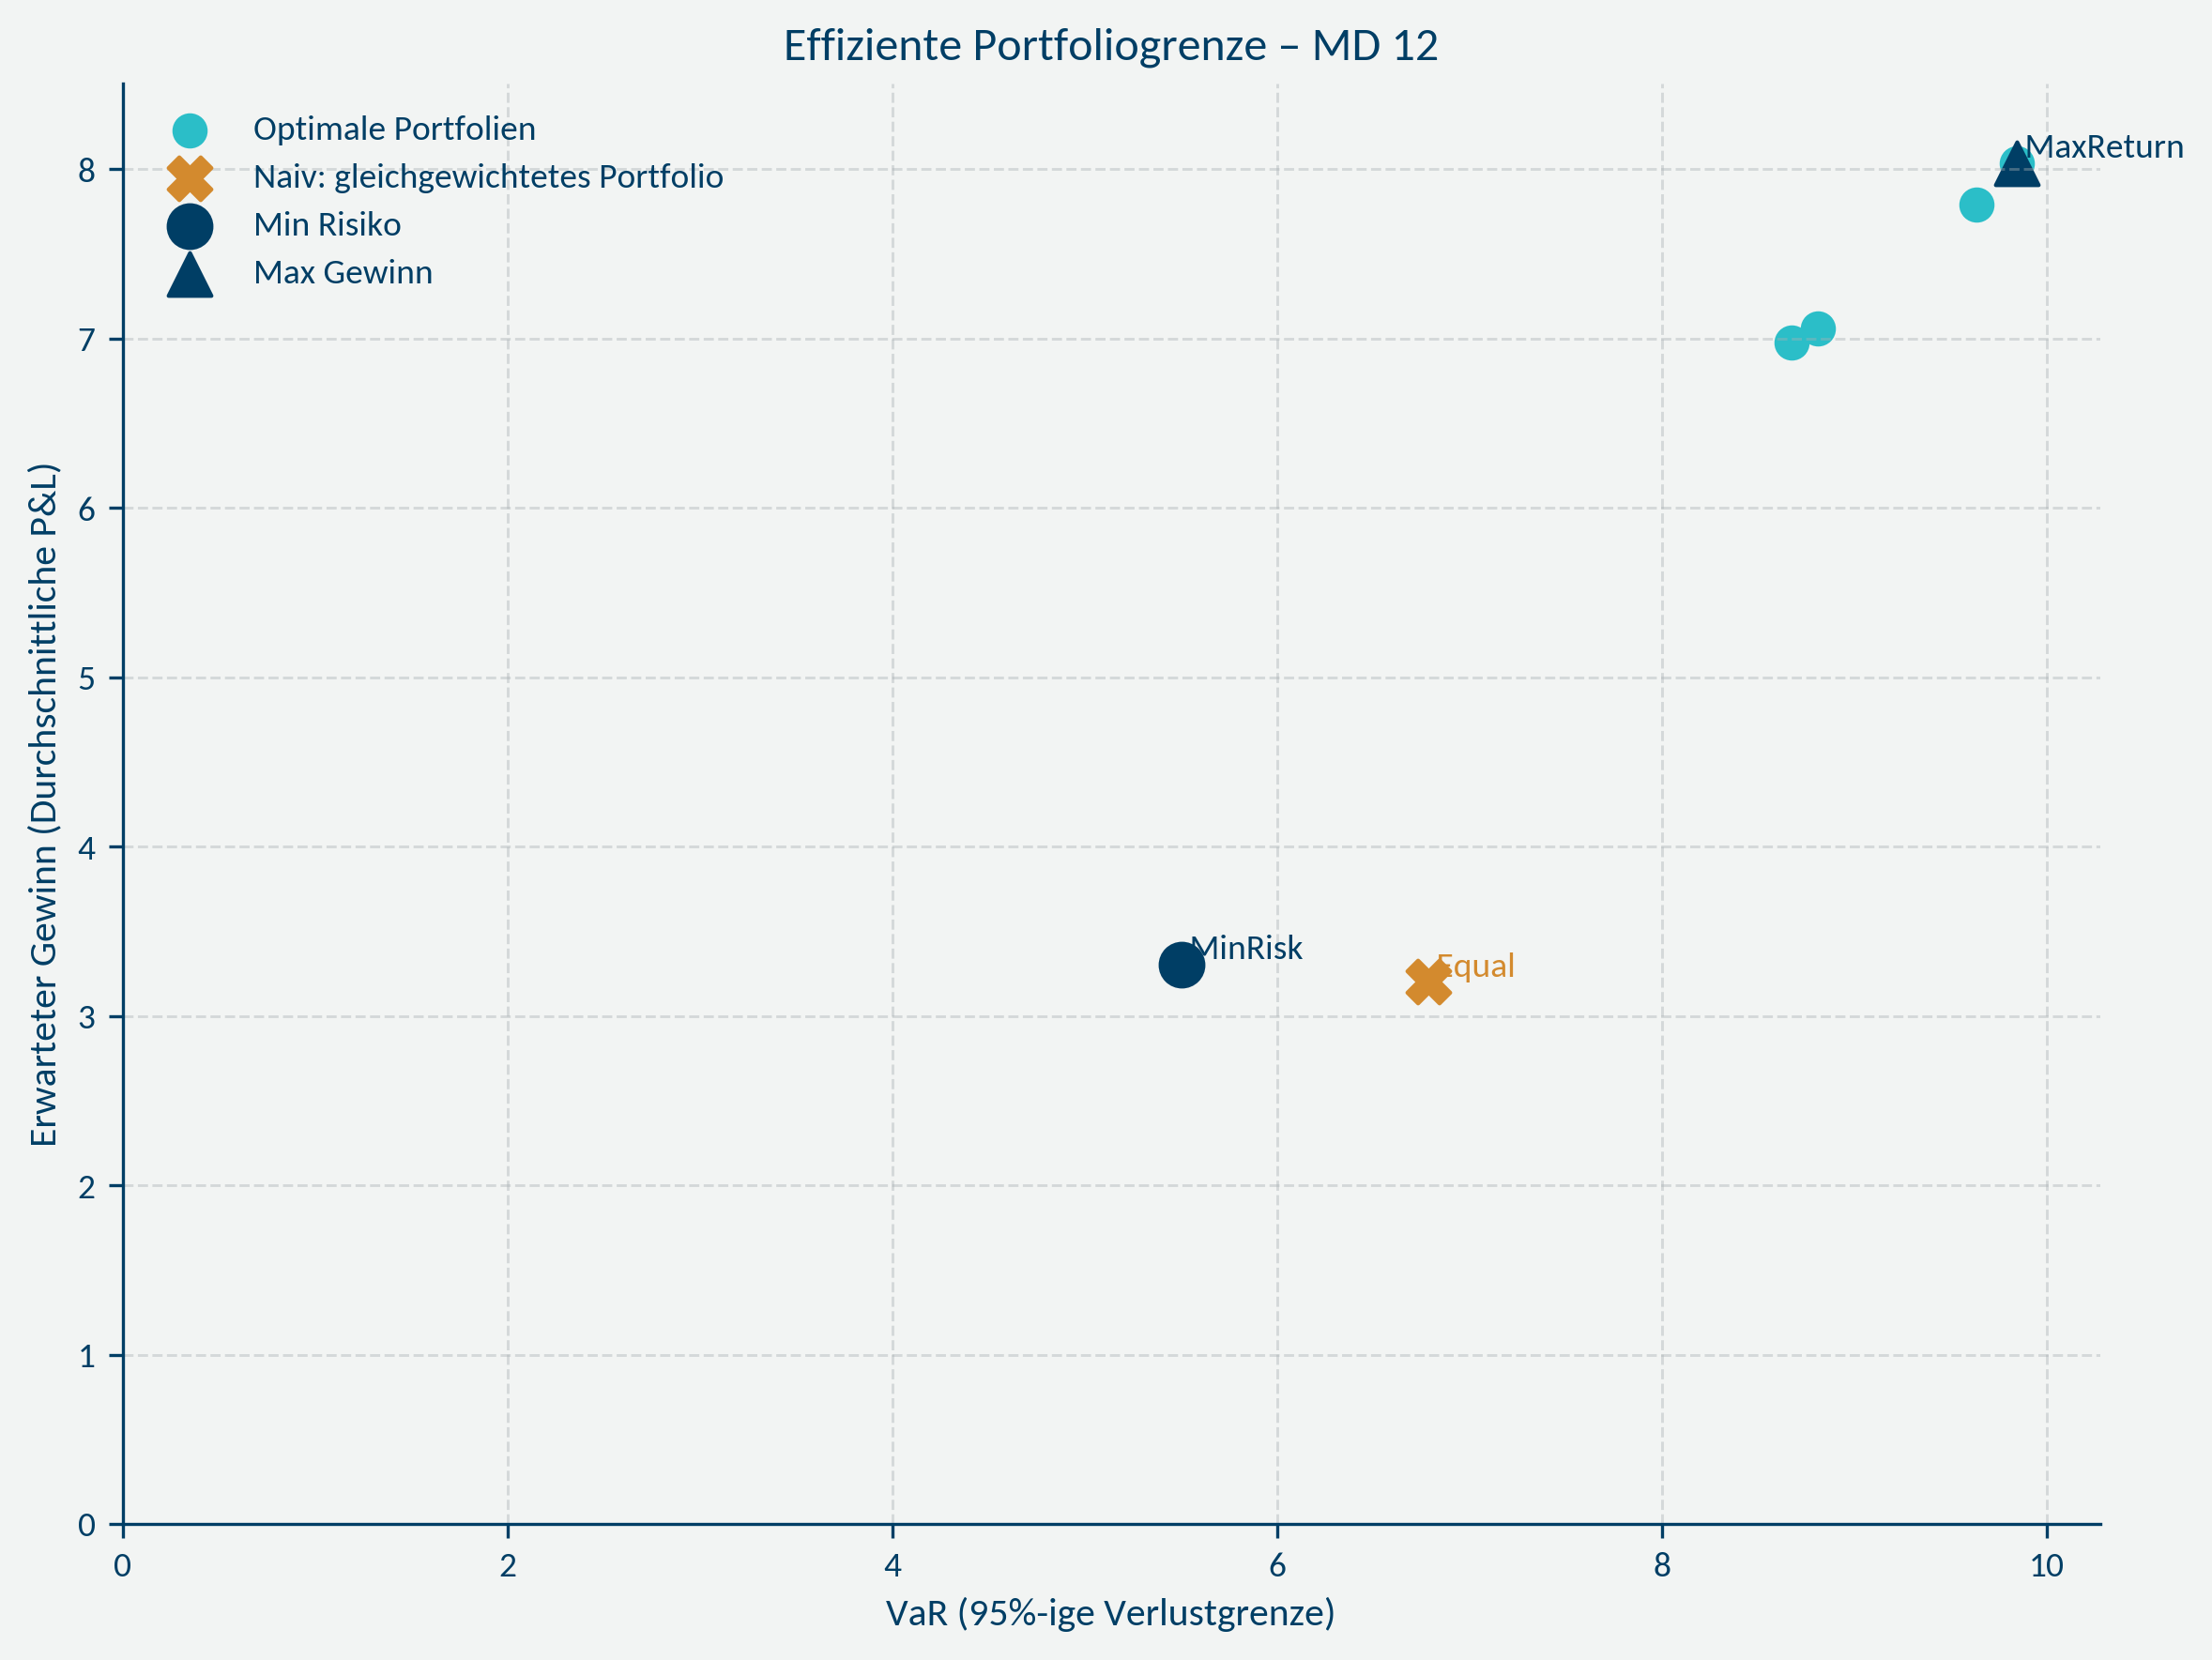
- Equal Weight: wide, uncontrolled dispersion.
- Min Risk: narrow, well-defined downside limits.
- Max Return: strong return potential but extremely concentrated exposure.
- Optimised λ-portfolios: balanced, risk-aware, and efficient.
The plot conveys more insight than paragraphs of text — it makes efficiency visible.
3. How strategies actually allocate capital
The allocation view illustrates the logic of each strategy:
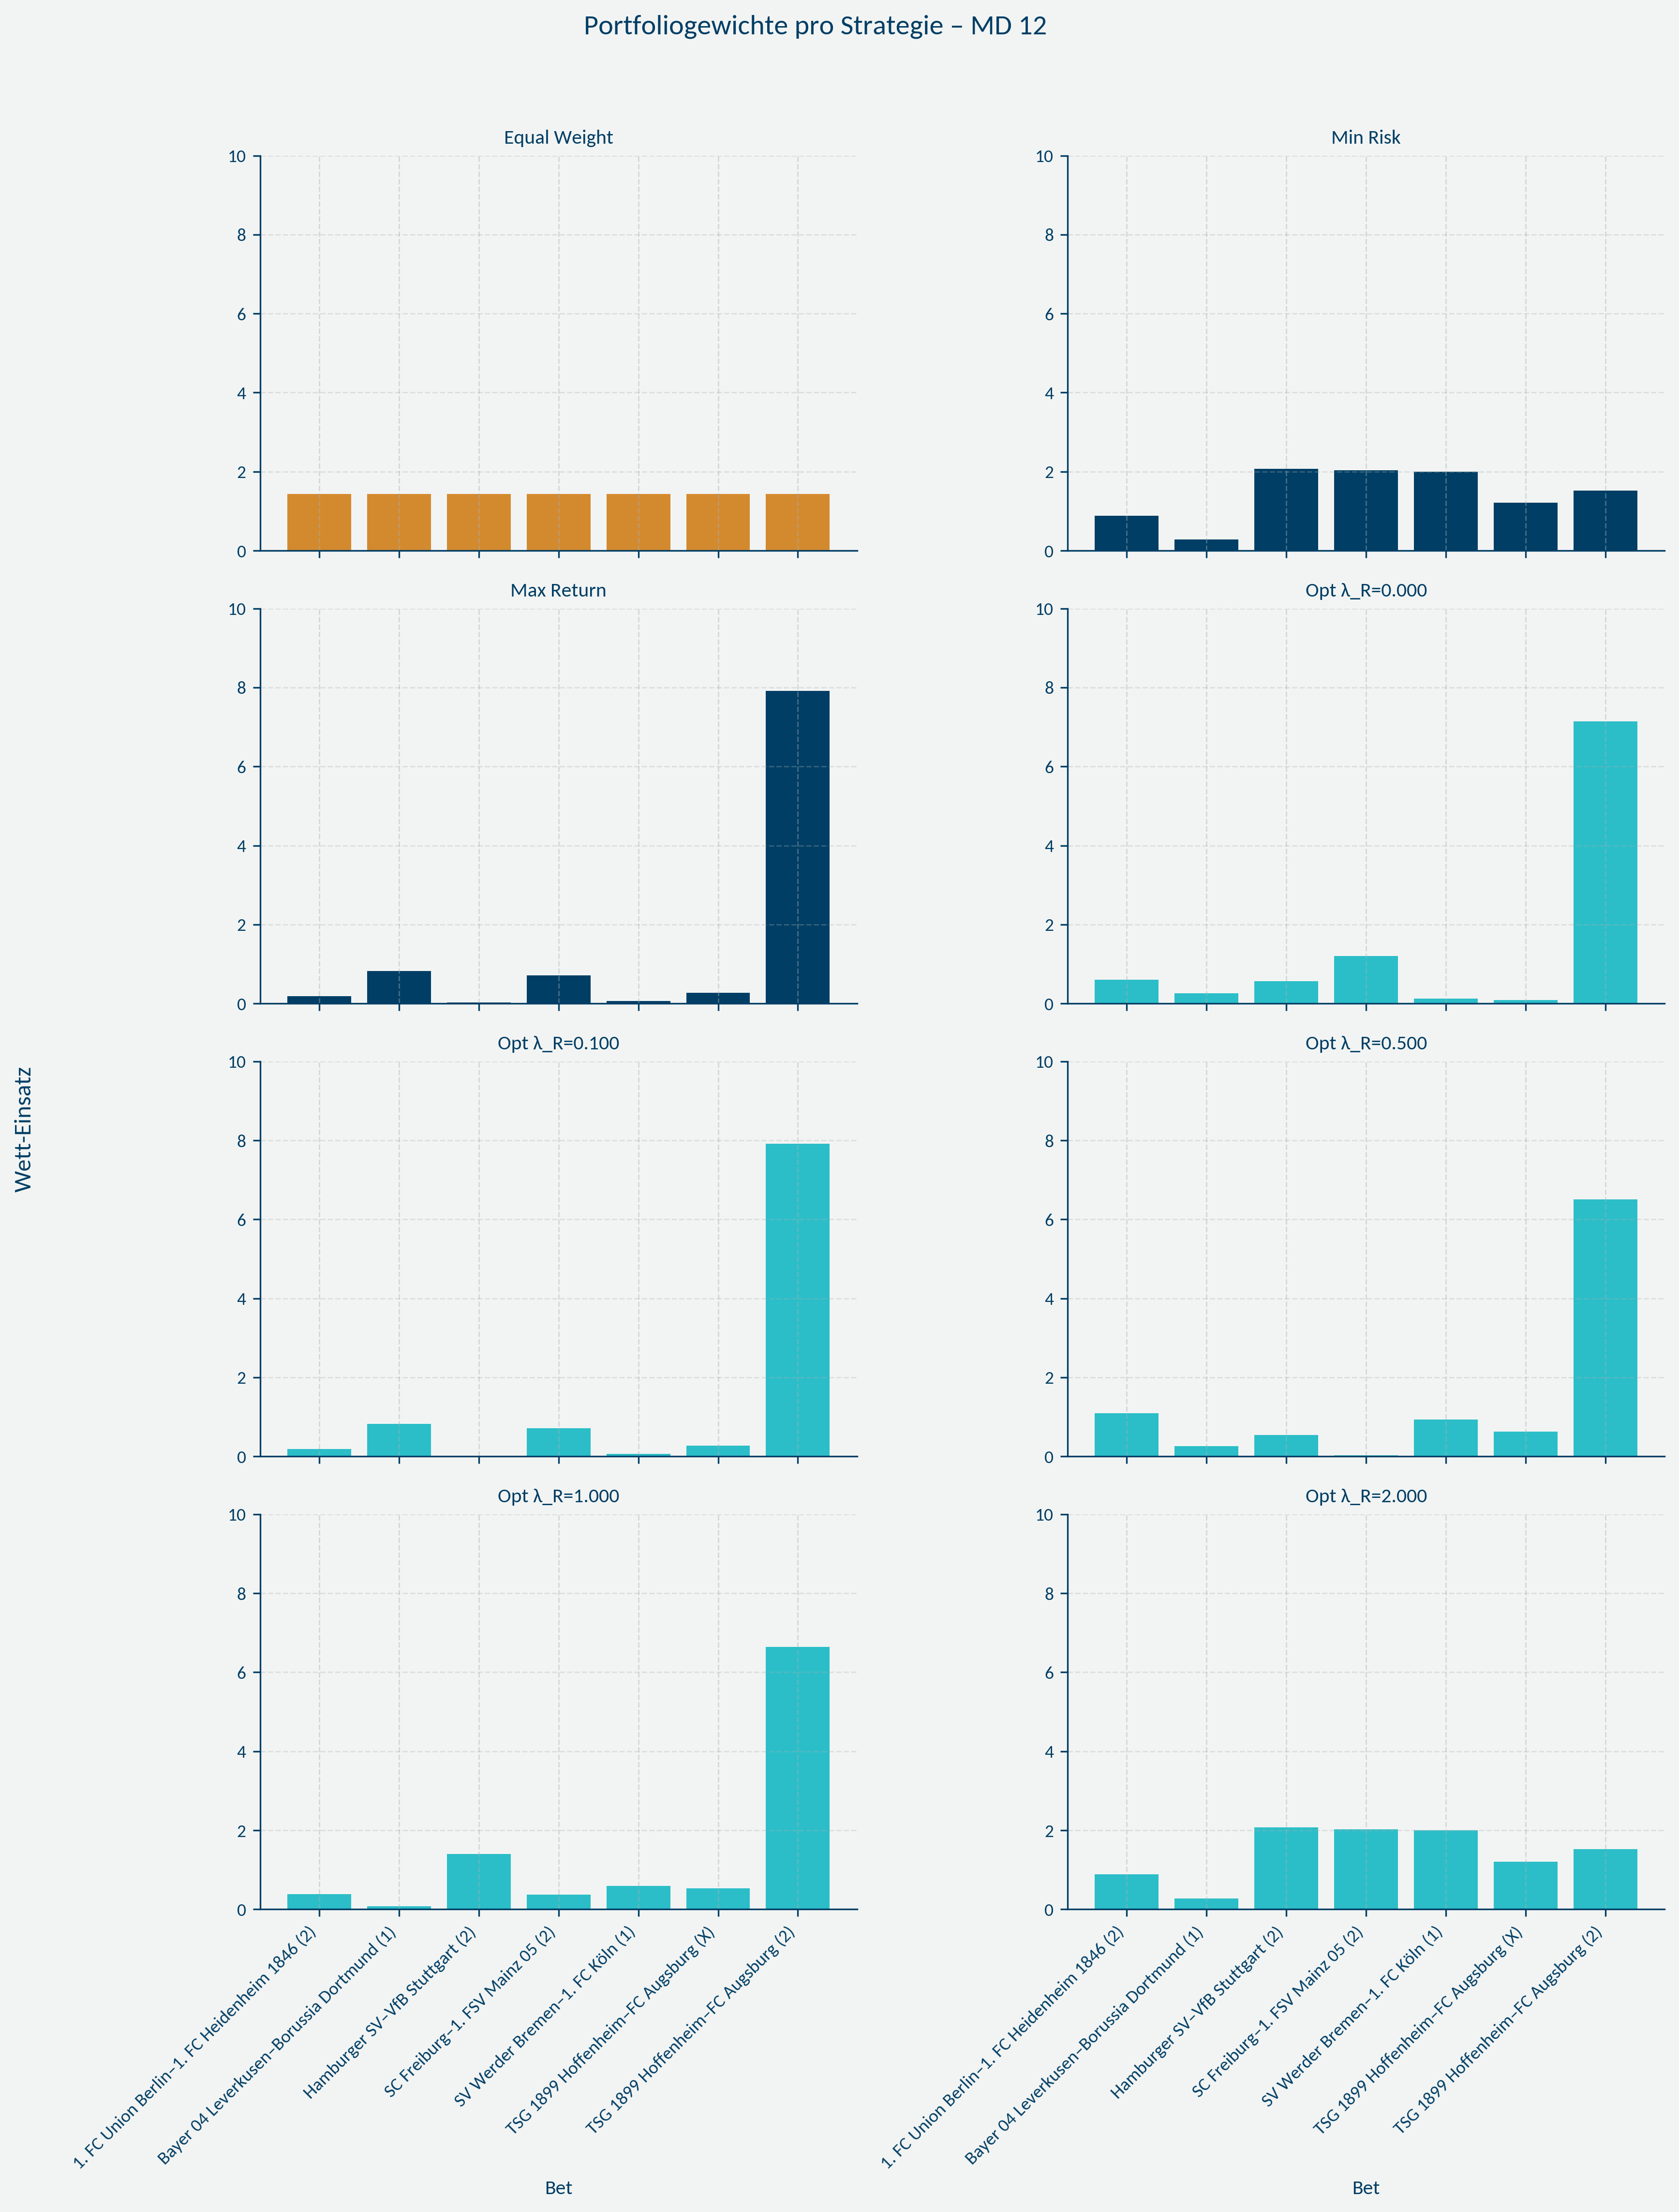
- Equal Weight distributes capital arbitrarily.
- Min Risk stabilises exposures through diversification.
- Max Return concentrates heavily on the highest EV bet.
- λ-portfolios balance return and diversification in line with risk preferences.
The benefit: misallocations appear visually, not retrospectively.
4. Comparing P&L distributions
The shape of each P&L distribution explains the strategy’s behaviour:
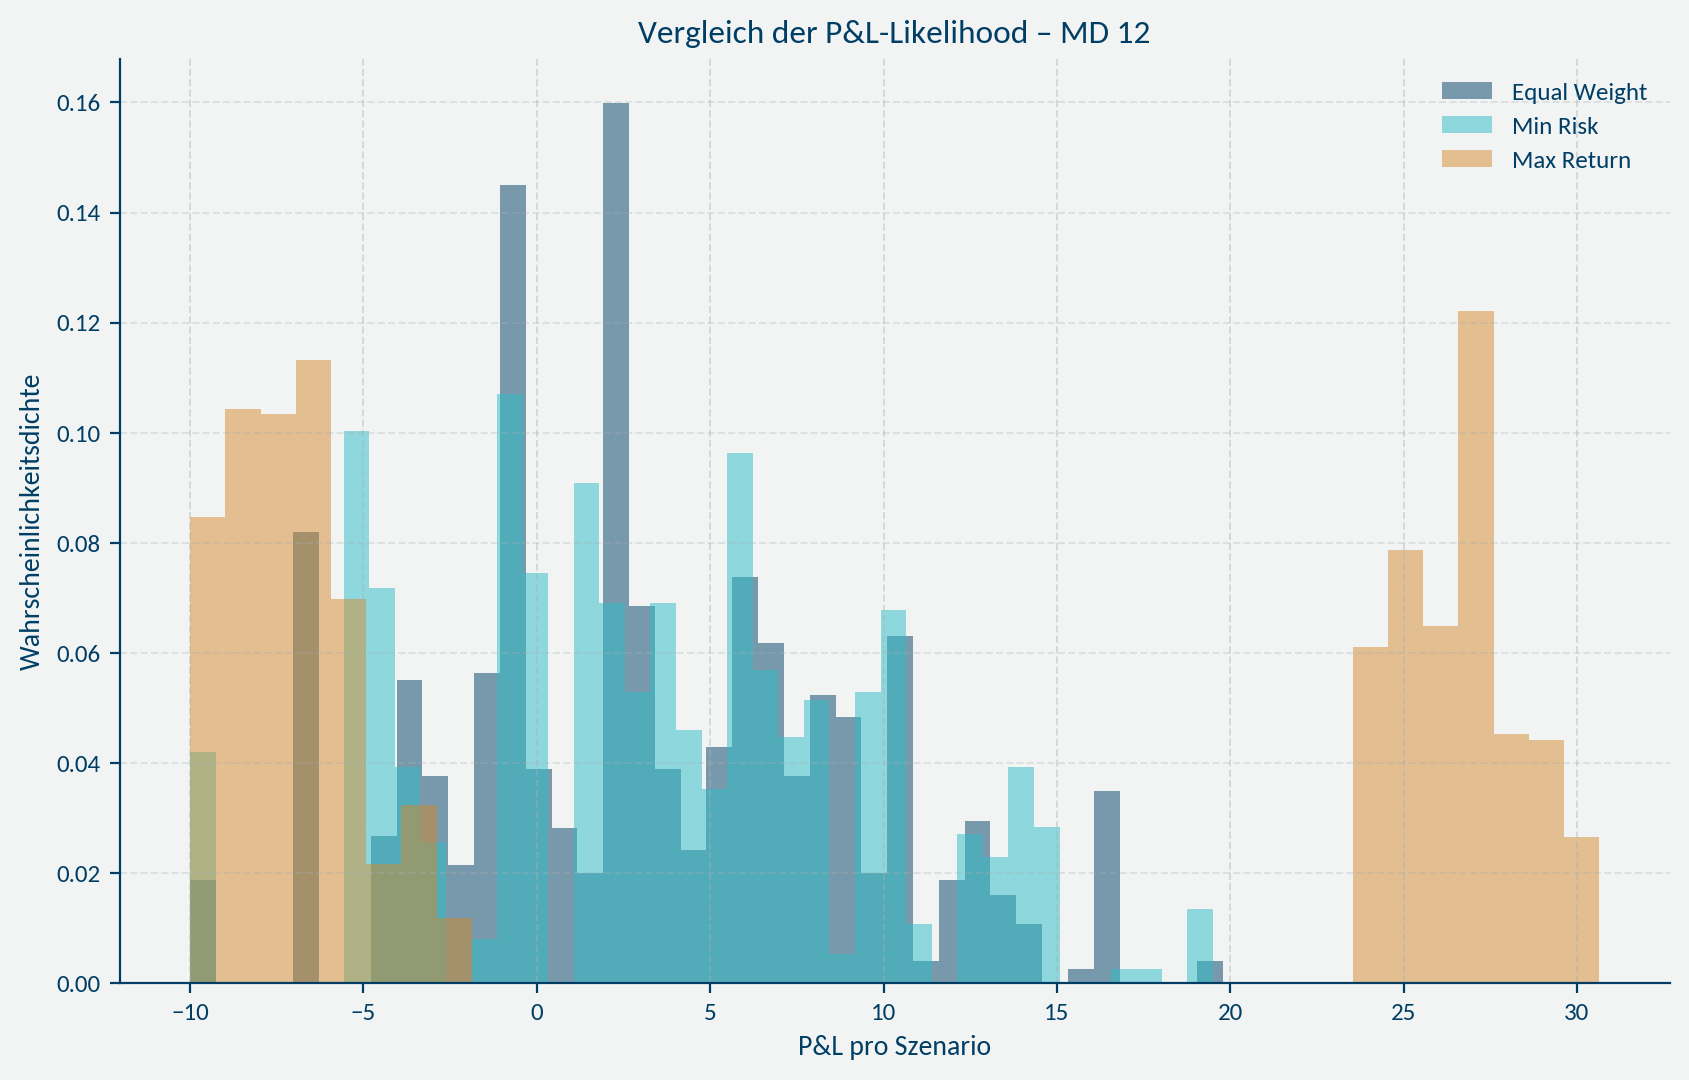
- Equal Weight: broad and unstructured.
- Min Risk: calm, tight, predictable.
- Max Return: volatile with wide swings.
- λ-portfolios: controlled transitions between the extremes.
Interpretation is guided by the chart, not assumptions.
5. Which bet contributes which risk?
Loss contributions show where risk originates:
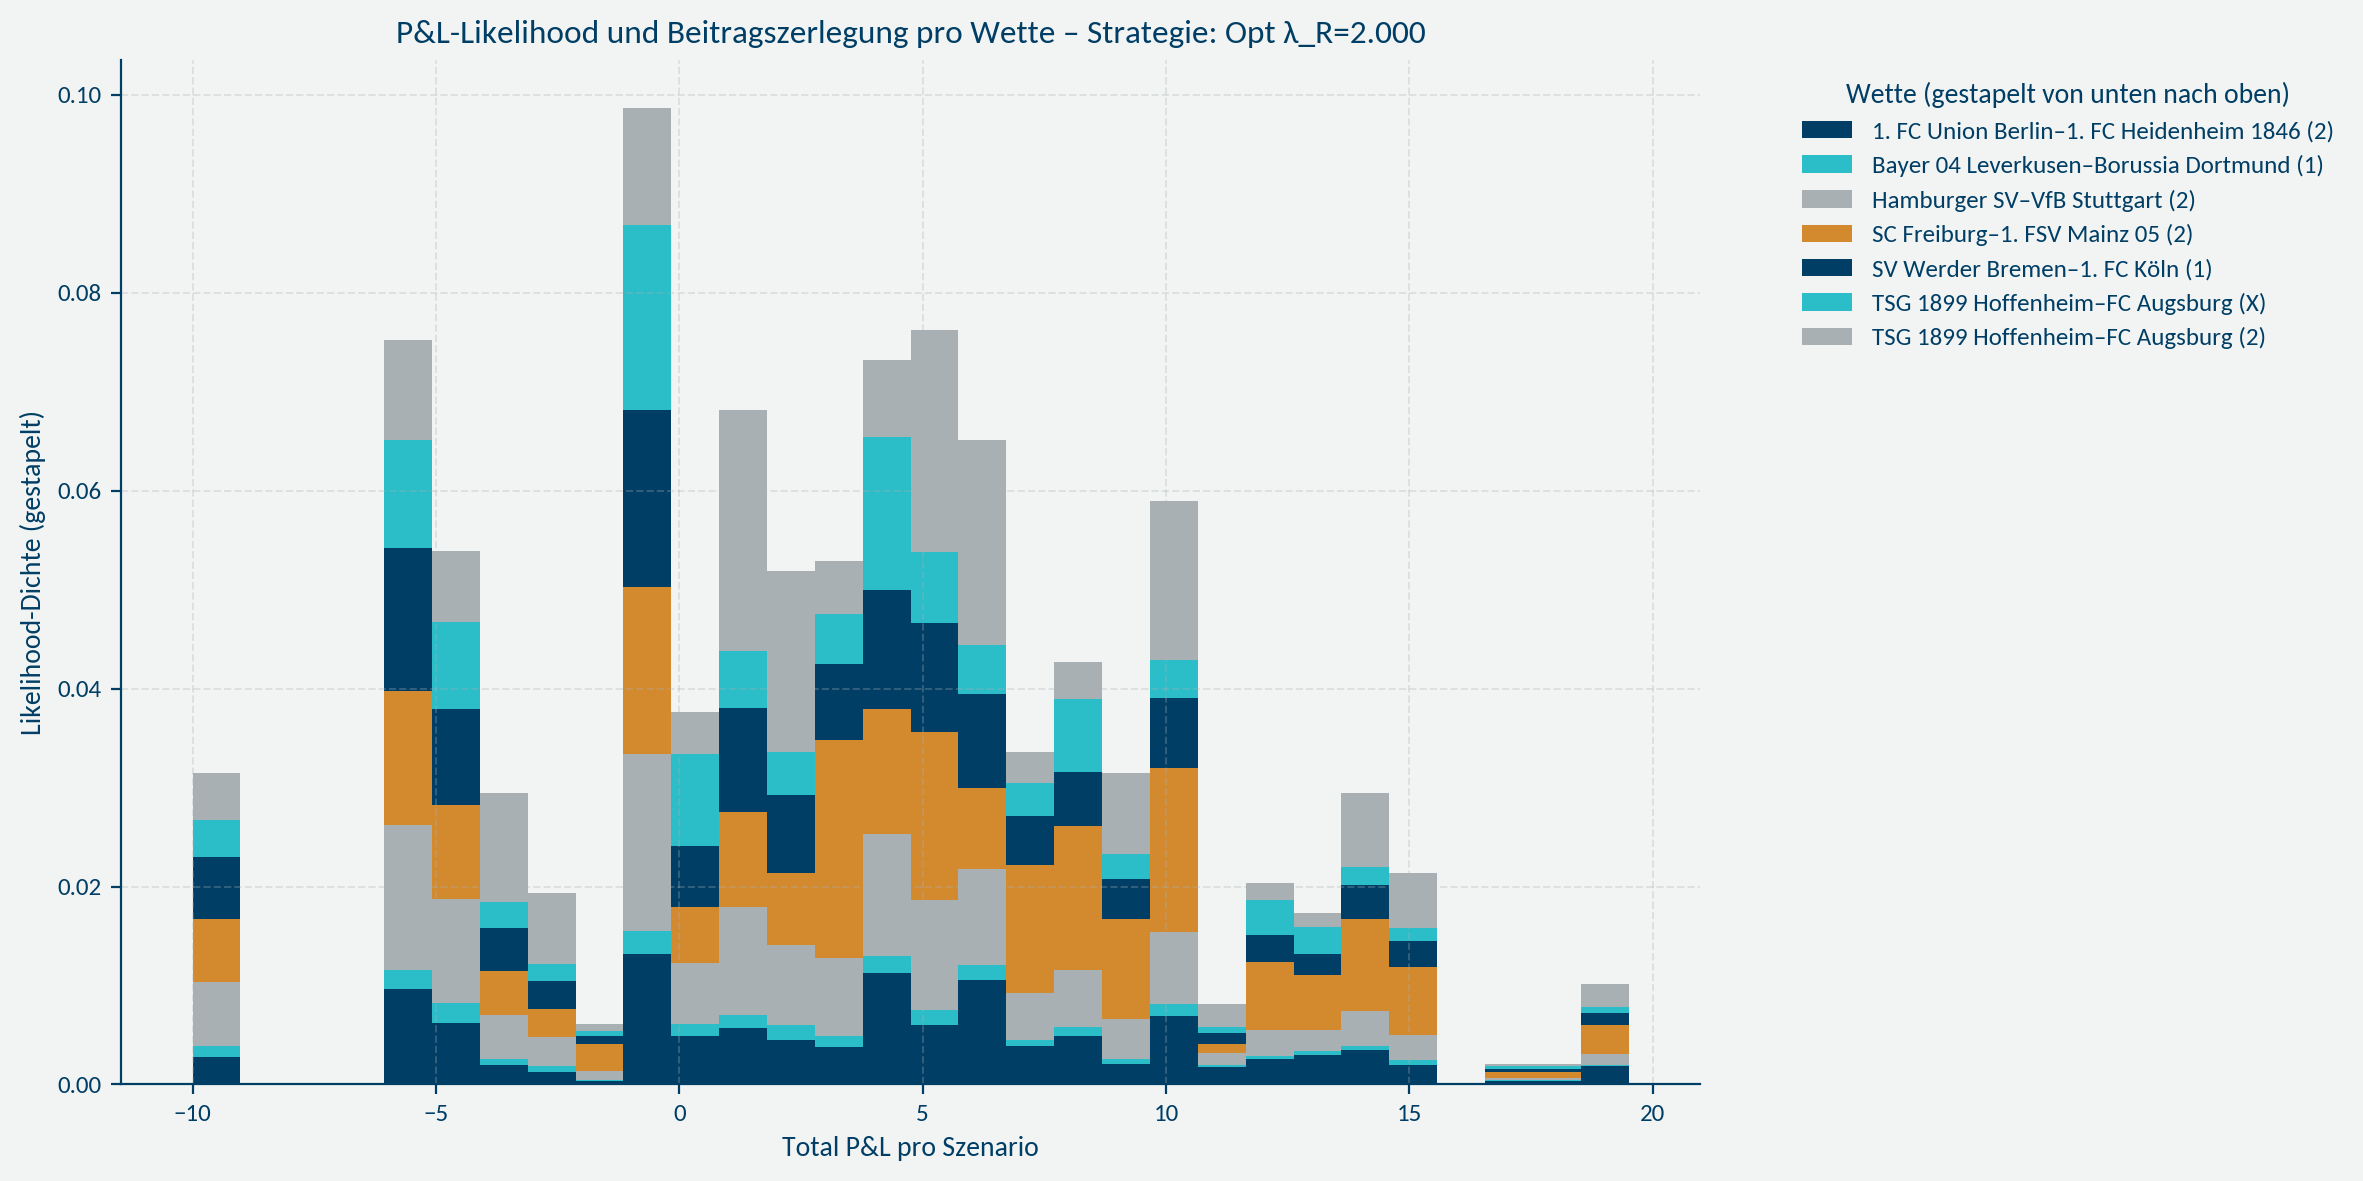
- Risk becomes attributable to individual bets.
- Dominant loss drivers stand out clearly.
- Portfolio decisions gain transparency and justification.
Risk management becomes explicit instead of conceptual.
Conclusion
Quantitative betting relies on structure, model-driven logic, and visual clarity:
- Value identifies opportunities — not stakes.
- Portfolios replace individual bets.
- Risk becomes visible before it materialises.
- Visualisations carry most of the insight; the text simply provides context.
This approach shifts decision-making from intuition to robust analytical judgement.
Tags: risk, portfolio-thinking, exposure-management, capital-management