<?xml version="1.0" encoding="utf-8"?><feed xmlns="http://www.w3.org/2005/Atom" ><generator uri="https://jekyllrb.com/" version="3.10.0">Jekyll</generator><link href="https://augmentedactuary.com/feed.xml" rel="self" type="application/atom+xml" /><link href="https://augmentedactuary.com/" rel="alternate" type="text/html" /><updated>2026-04-03T09:44:04+00:00</updated><id>https://augmentedactuary.com/feed.xml</id><title type="html">Bernhard Ulrich von Boyen</title><subtitle>Actuarial intelligence, cross-domain analytics, projects with integrity &amp; AI</subtitle><author><name>Bernhard von Boyen</name></author><entry><title type="html">When Frictions Matter: From Models to Decision Systems</title><link href="https://augmentedactuary.com/2026/03/31/Frictions-matter.html" rel="alternate" type="text/html" title="When Frictions Matter: From Models to Decision Systems" /><published>2026-03-31T08:00:00+00:00</published><updated>2026-03-31T08:00:00+00:00</updated><id>https://augmentedactuary.com/2026/03/31/Frictions-matter</id><content type="html" xml:base="https://augmentedactuary.com/2026/03/31/Frictions-matter.html"><![CDATA[<h2 id="key-messages">Key Messages</h2>

<ul>
  <li><strong>Friction is real and structural.</strong> It does not disappear — it reshapes decisions.</li>
  <li><strong>Models remain valid.</strong> But without system context, they become incomplete.
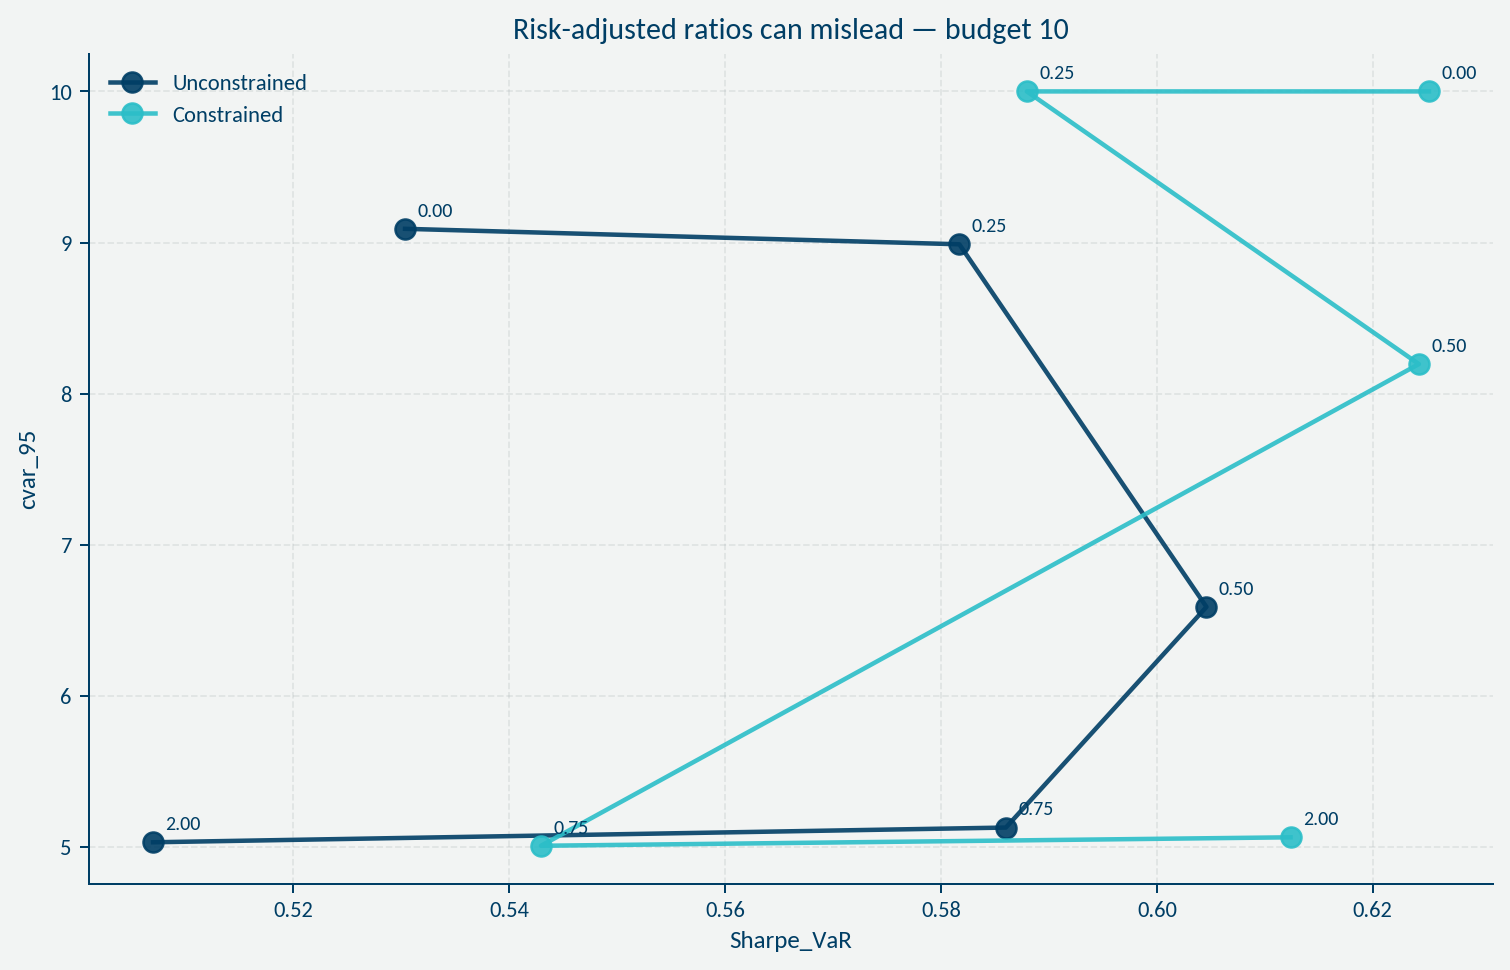
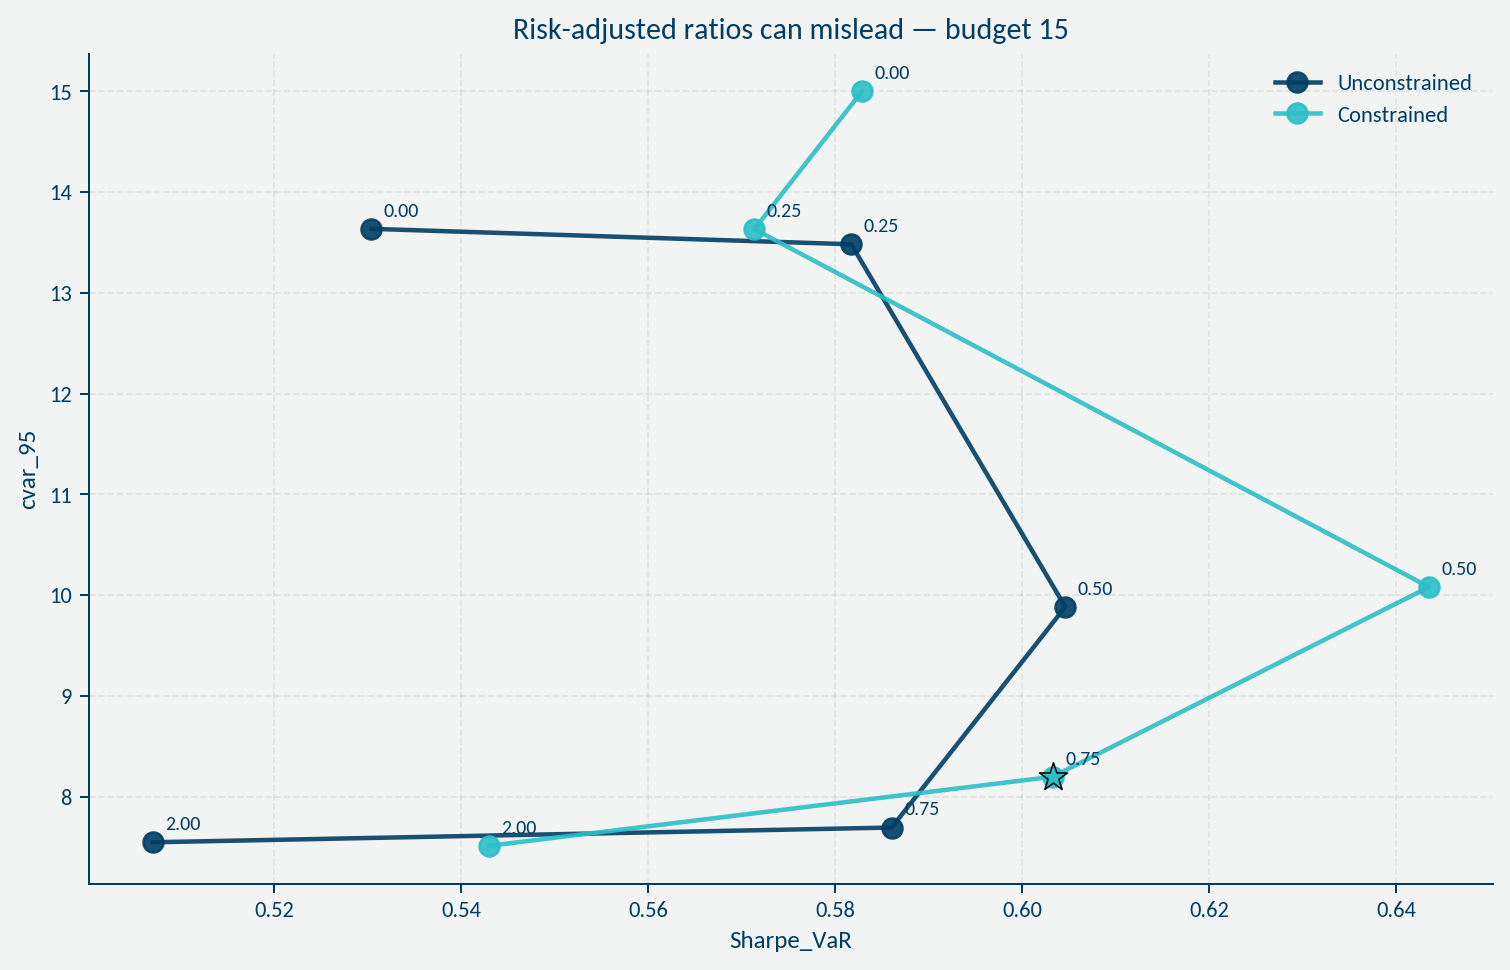
</li>
  <li><strong>Risk-adjusted metrics can mislead.</strong> Structure changes even when metrics look stable.</li>
  <li><strong>Heavy-tail environments amplify friction.</strong> Effects become multiplicative, not marginal.</li>
  <li><strong>Admissibility matters.</strong> Not every acceptable risk can be executed.
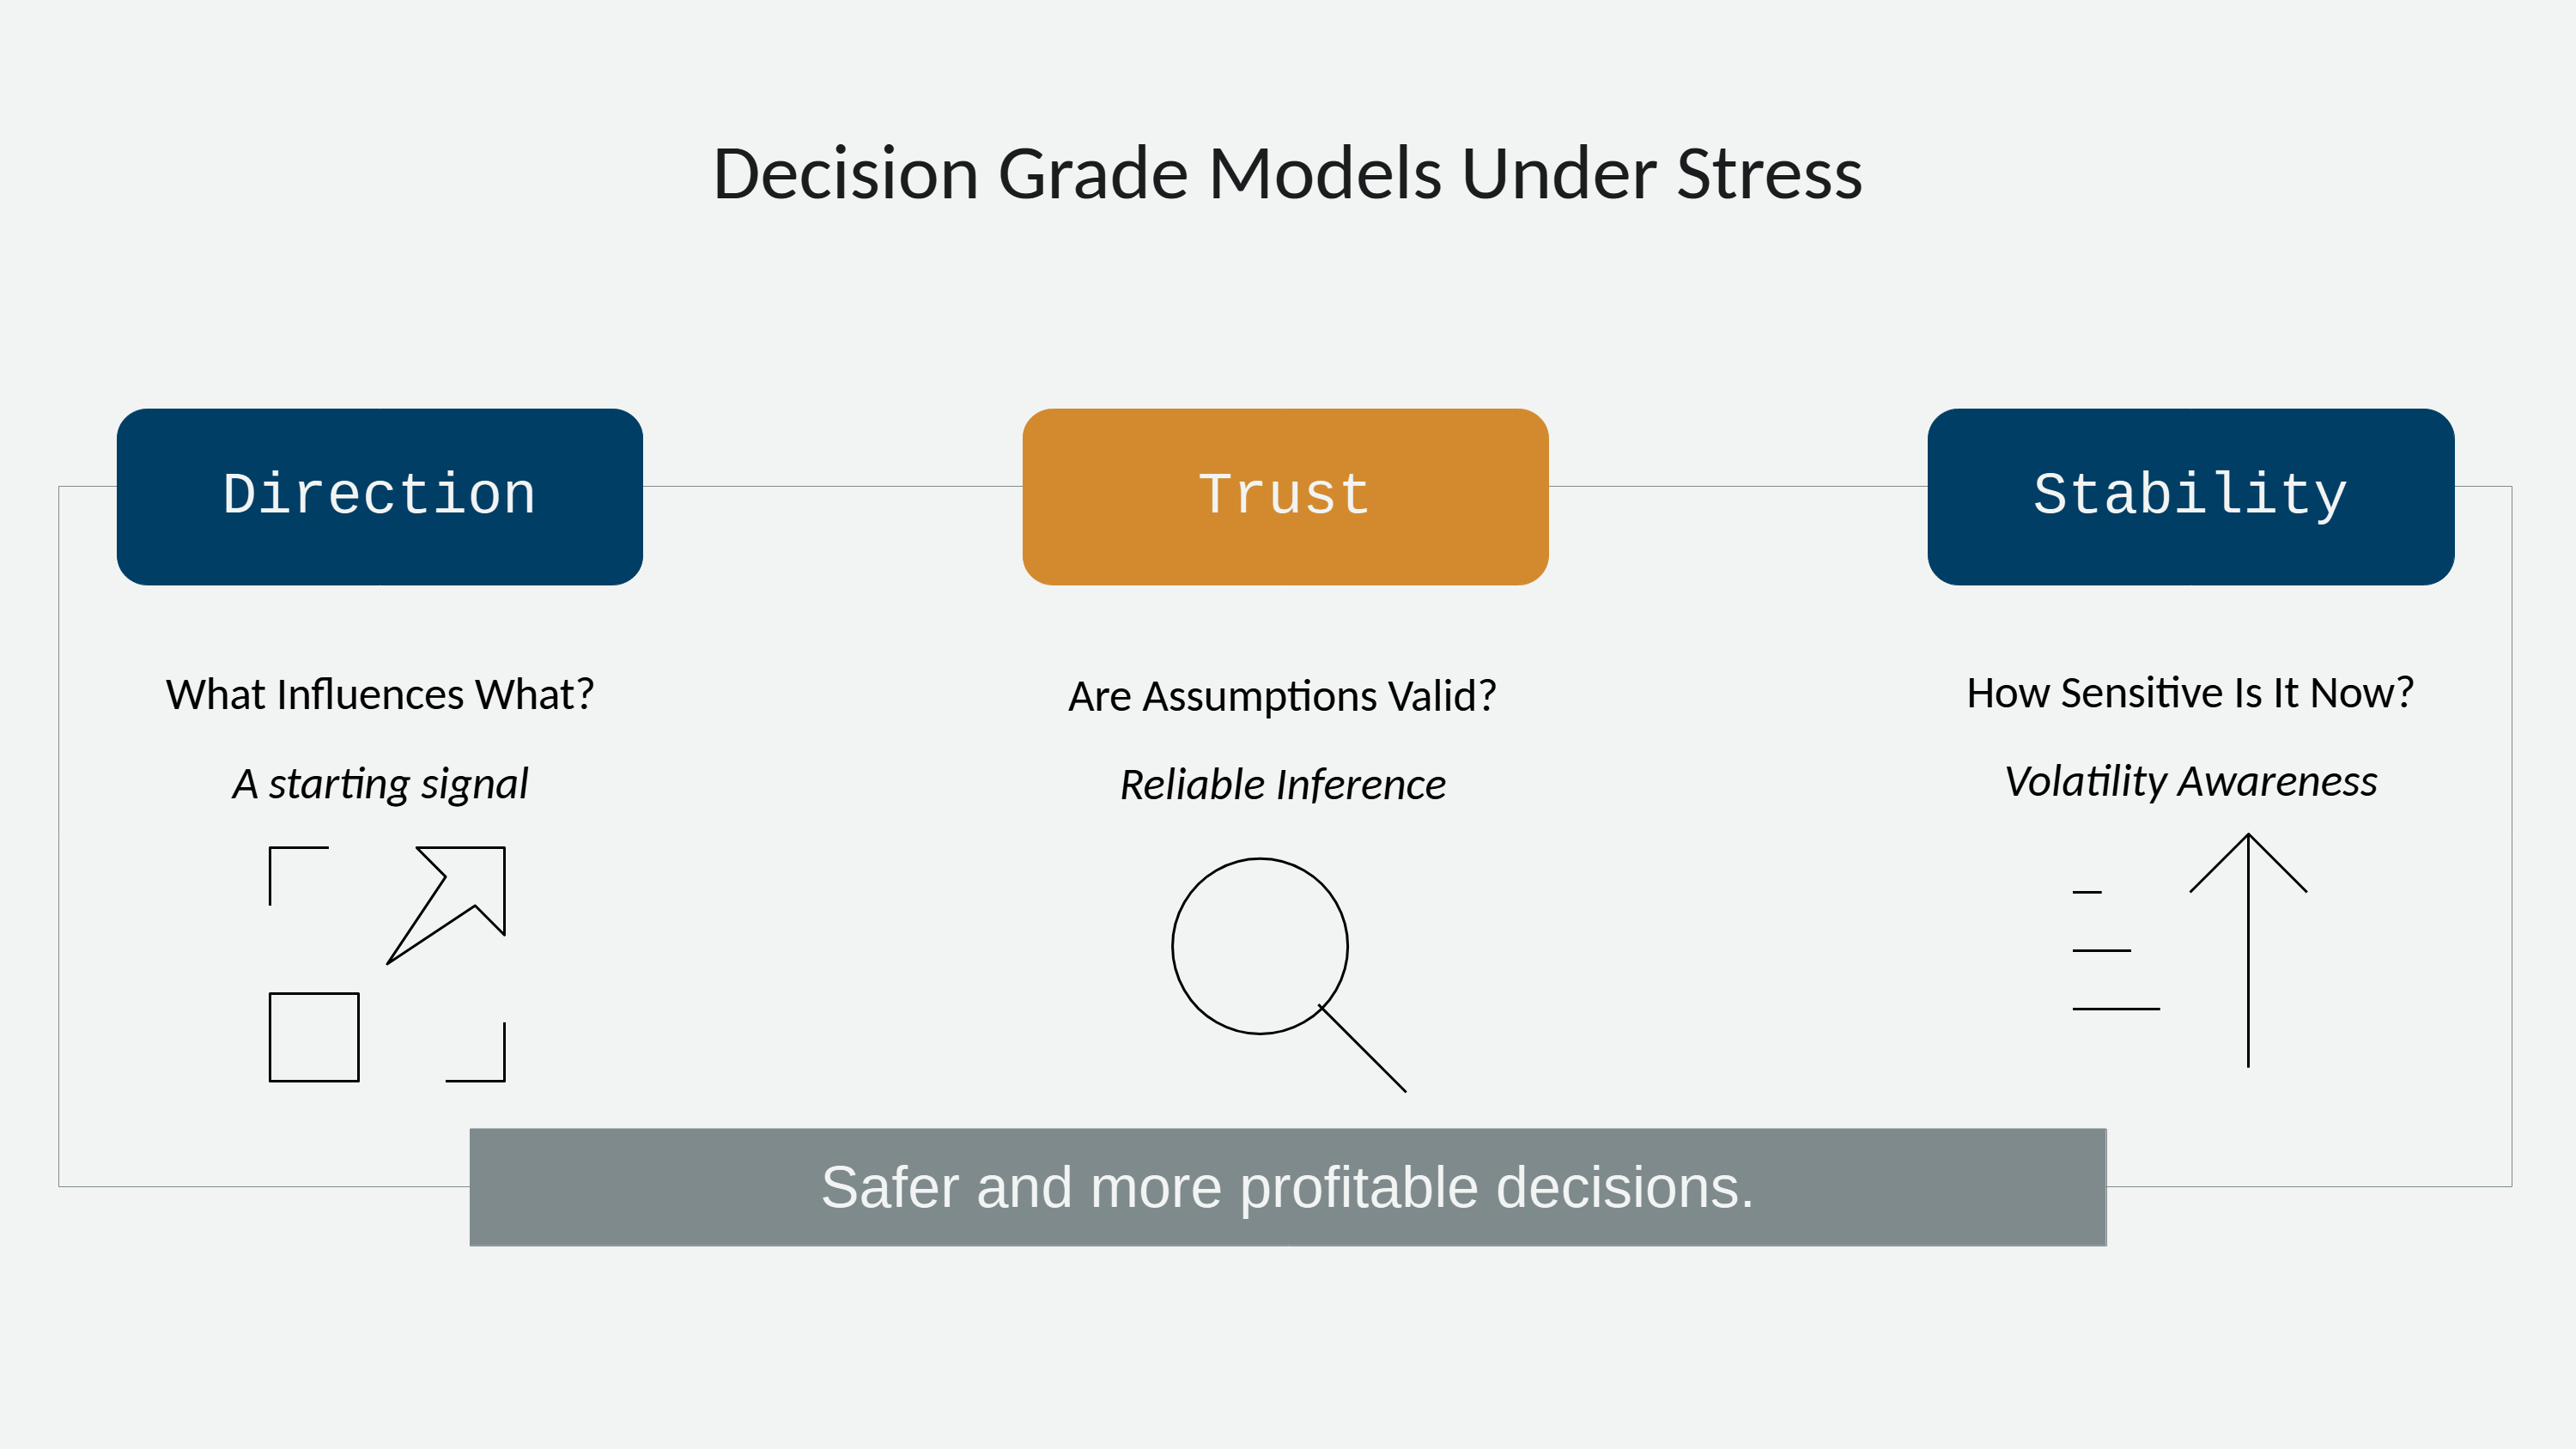
</li>
  <li><strong>Diagnostics create clarity.</strong> Making friction explicit increases decision confidence.</li>
  <li><strong>Options unlock capacity.</strong> Maintaining choice enables selecting the right strategy.</li>
</ul>

<hr />

<p>Nothing looked wrong in the model.</p>

<p>And yet, the system behaved differently.</p>

<p>That was the starting point for this piece.</p>

<p>
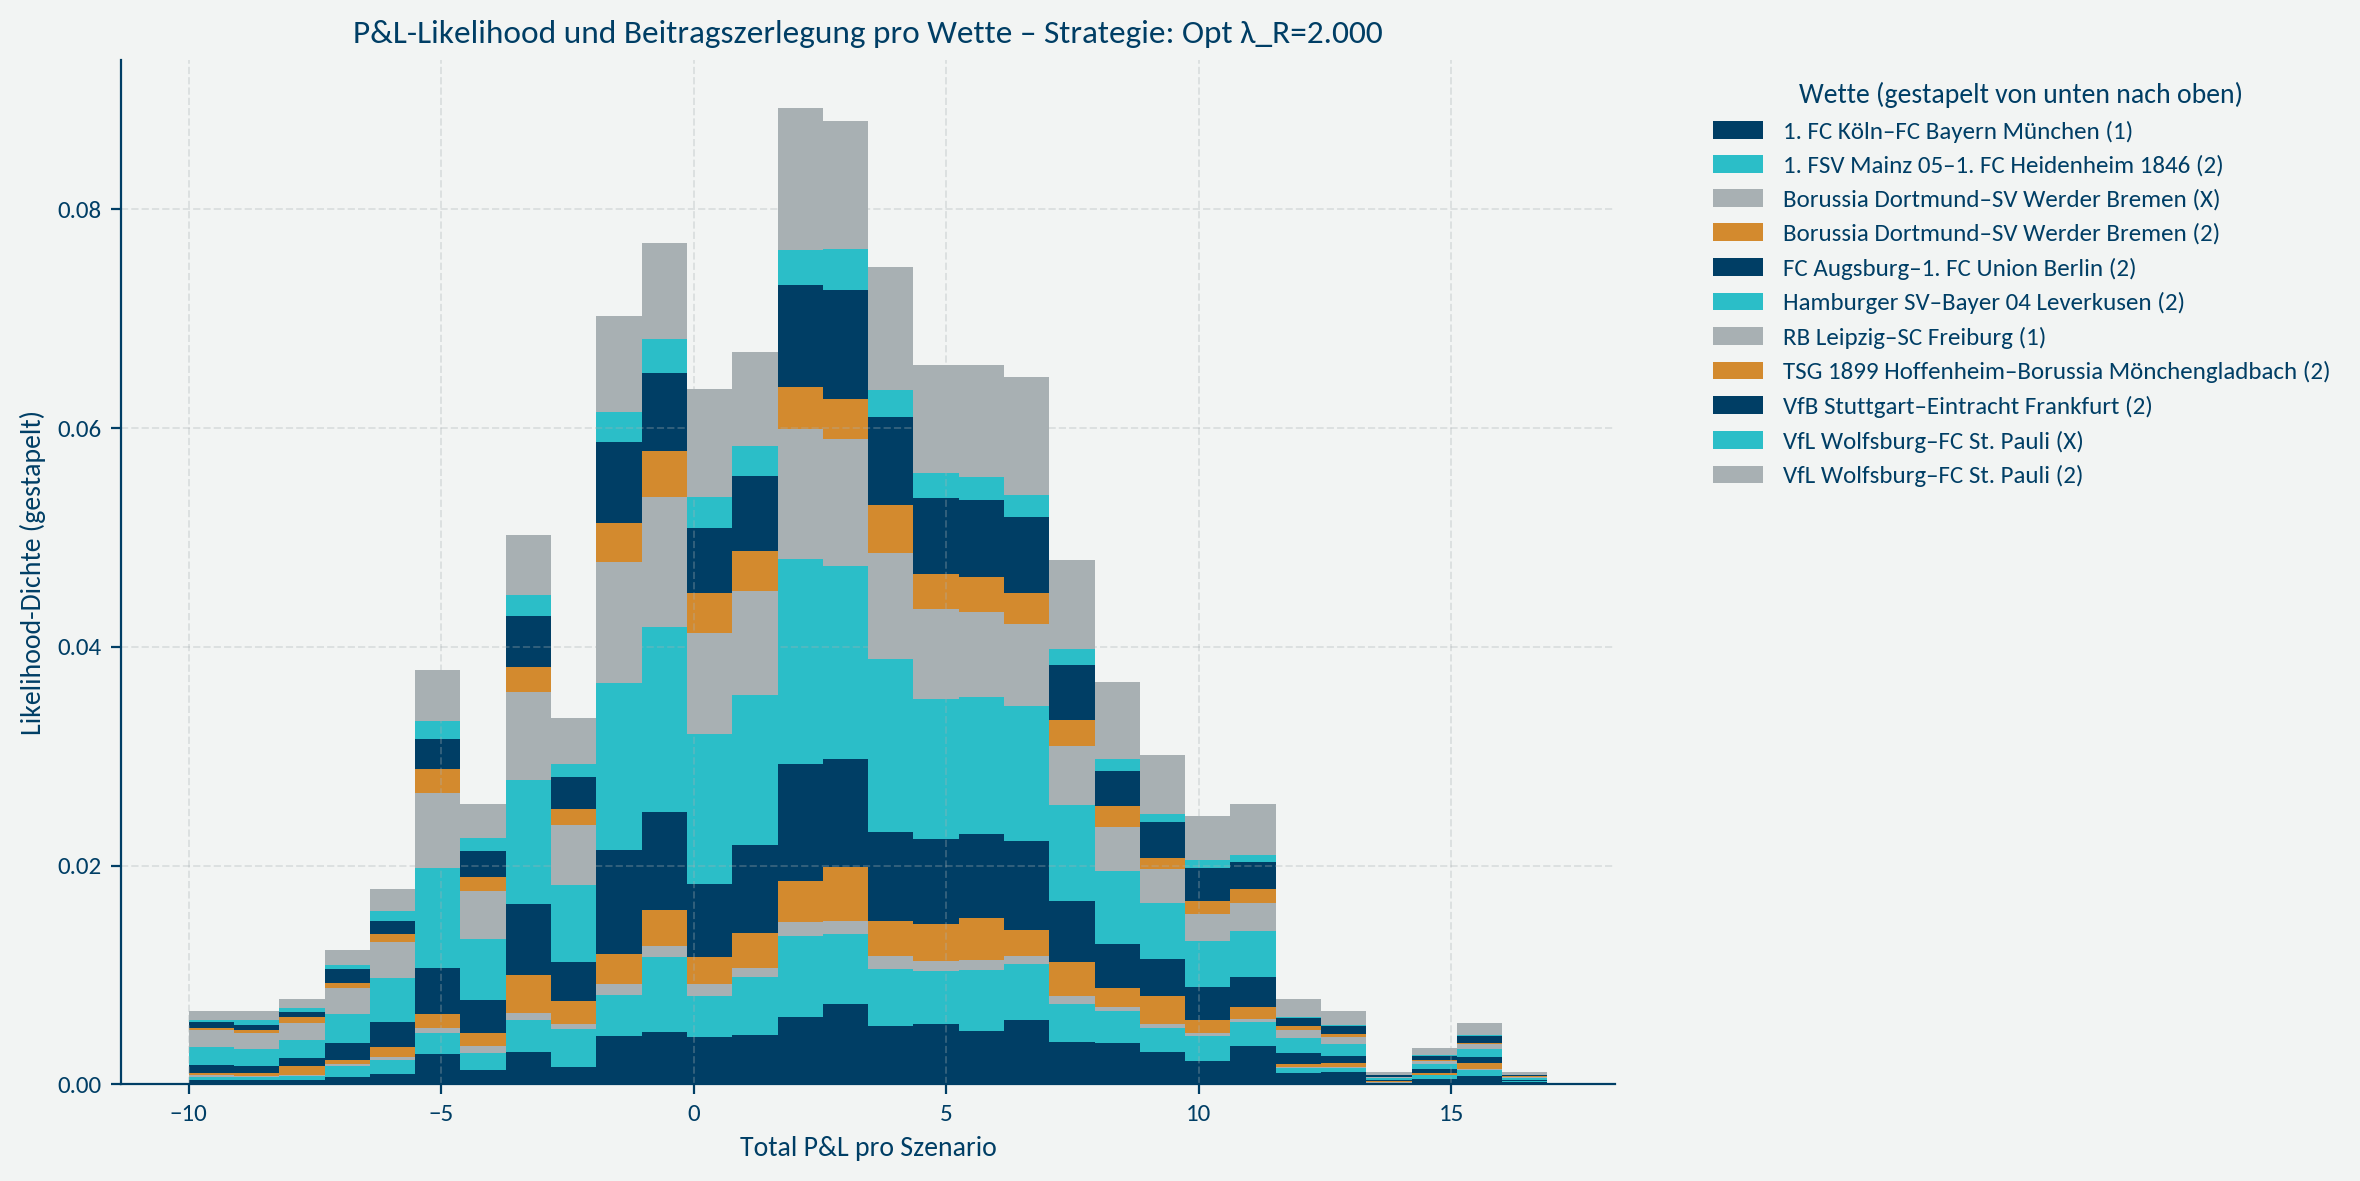
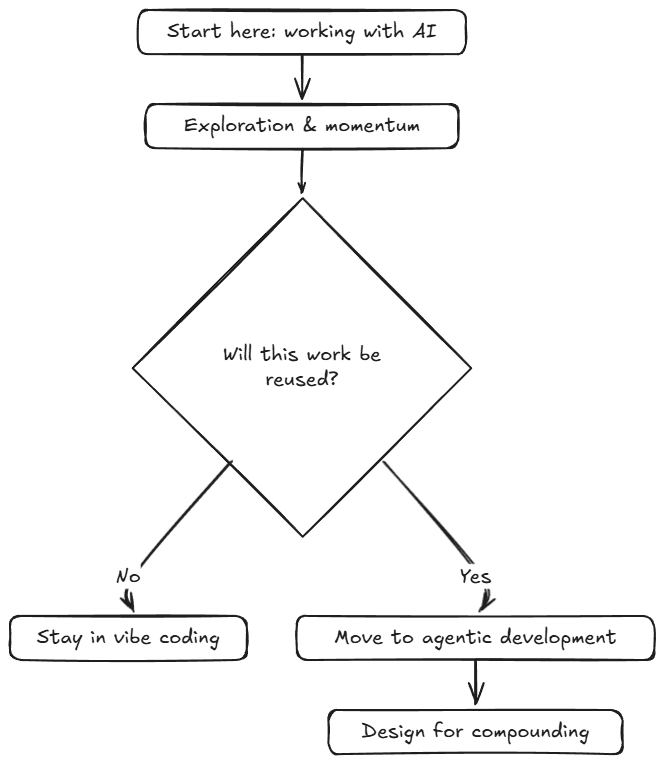
I have been using the SoccerSim Lab as a controlled decision laboratory — a simple way to translate market constraints into portfolio decisions and observe what happens when a measurable edge meets real execution constraints.</p>

<p>What I expected was a cleaner translation from model to portfolio.</p>

<p>What I observed was more uncomfortable:<br />
the edge remained, but the path changed.<br />
The model was not wrong — but the system was more constrained than assumed.</p>

<hr />

<h2 id="the-last-mile-matters">The last mile matters</h2>

<p>
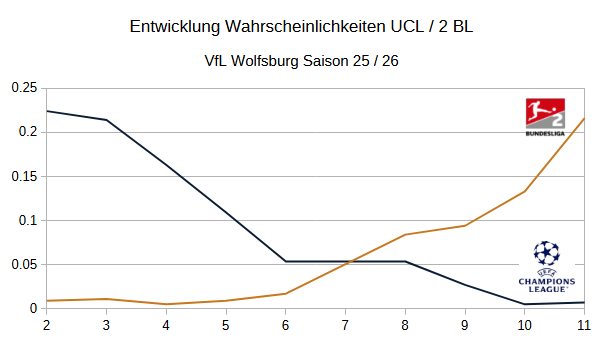
The first signals came from the last mile.</p>

<p>
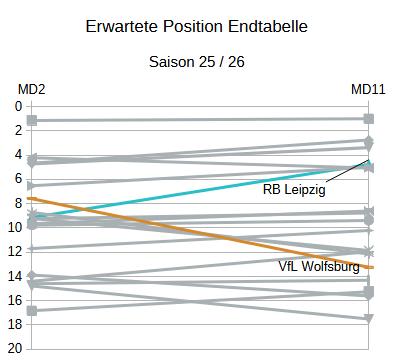
The optimal unconstrained allocation had to be adjusted to discrete stake sizes imposed by the counterparty. Some positions were simply cancelled. Performance did not disappear, but it emerged more slowly than expected. The P&amp;L still revealed an edge — but the path was different.</p>

<div class="figure-grid two-col">
  <figure class="post-figure">
    <img src="/assets/img/soccersim_last_mile_weights_budget10.png" alt="Budget 10: unconstrained versus constrained portfolio weights with cancelled positions below minimum stake" loading="lazy" decoding="async" />
    <figcaption class="caption">
      Budget 10 — the last mile matters: optimal, unconstrained allocations break under minimum stake constraints (budget and appetite unchanged).
    </figcaption>
  </figure>

  <figure class="post-figure">
    <img src="/assets/img/soccersim_last_mile_weights_budget15.png" alt="Budget 15: unconstrained versus constrained portfolio weights with reduced but persistent distortions" loading="lazy" decoding="async" />
    <figcaption class="caption">
      Budget 15 — scale softens the distortion, but does not remove it.
    </figcaption>
  </figure>
</div>

<p>
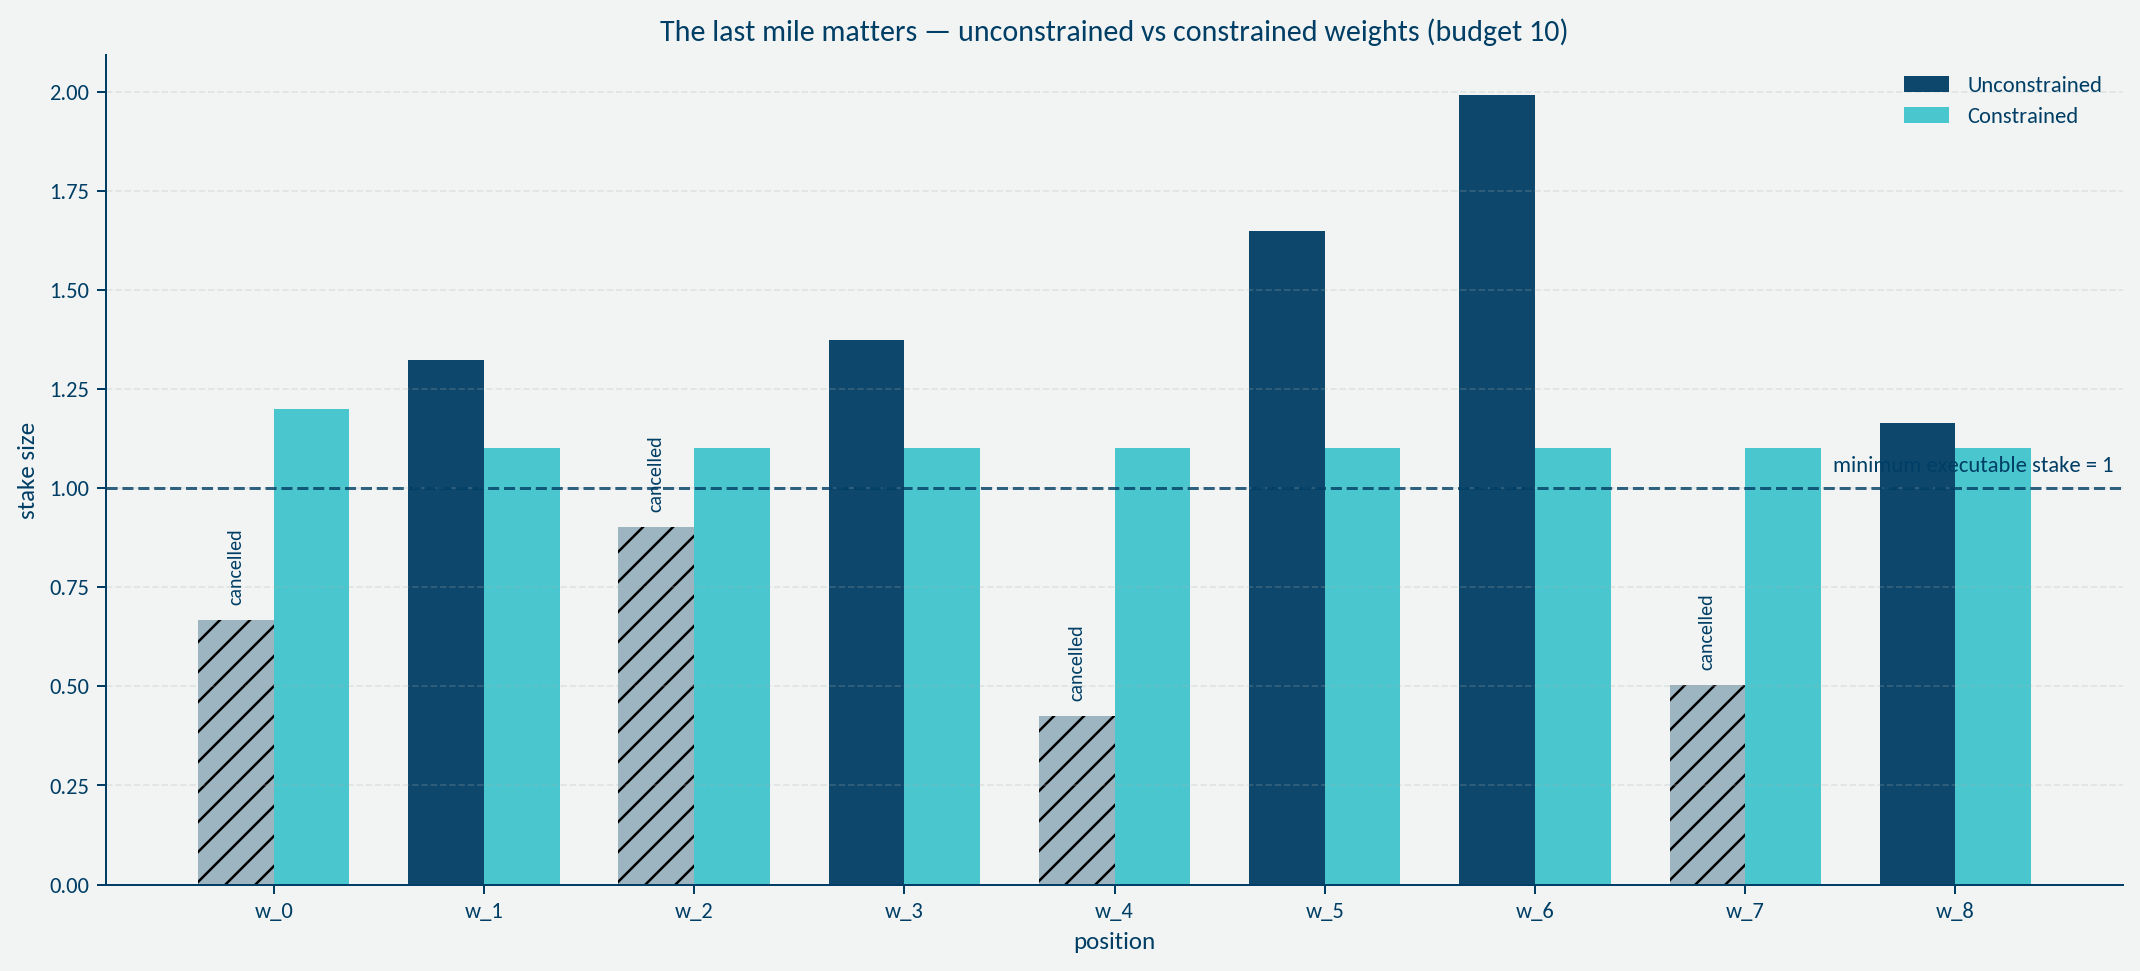
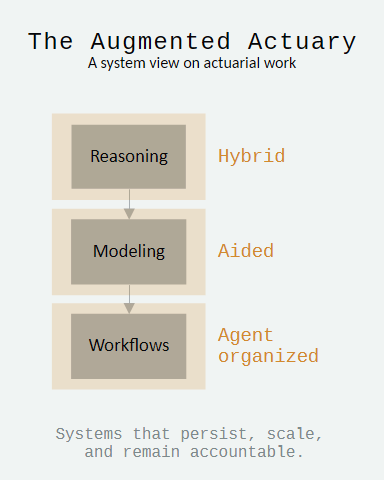
This was the first step toward a more augmented view of actuarial work: not just looking at the model, but at the system the model has to survive in.</p>

<hr />

<h2 id="friction-is-not-theoretical">Friction is not theoretical</h2>

<p>What looks like a technical detail in a model is very real in insurance.</p>

<p>Friction shows up in many forms:</p>
<ul>
  <li>local capital and regulatory constraints</li>
  <li>globally diverging capital models</li>
  <li>underwriting realities such as line sizes, authority limits, and placement constraints</li>
</ul>

<p>These are not edge cases. They are part of the system. They quietly cancel positions and reshape P&amp;L in the background. They directly affect what can be written, how much, and when.</p>

<p>
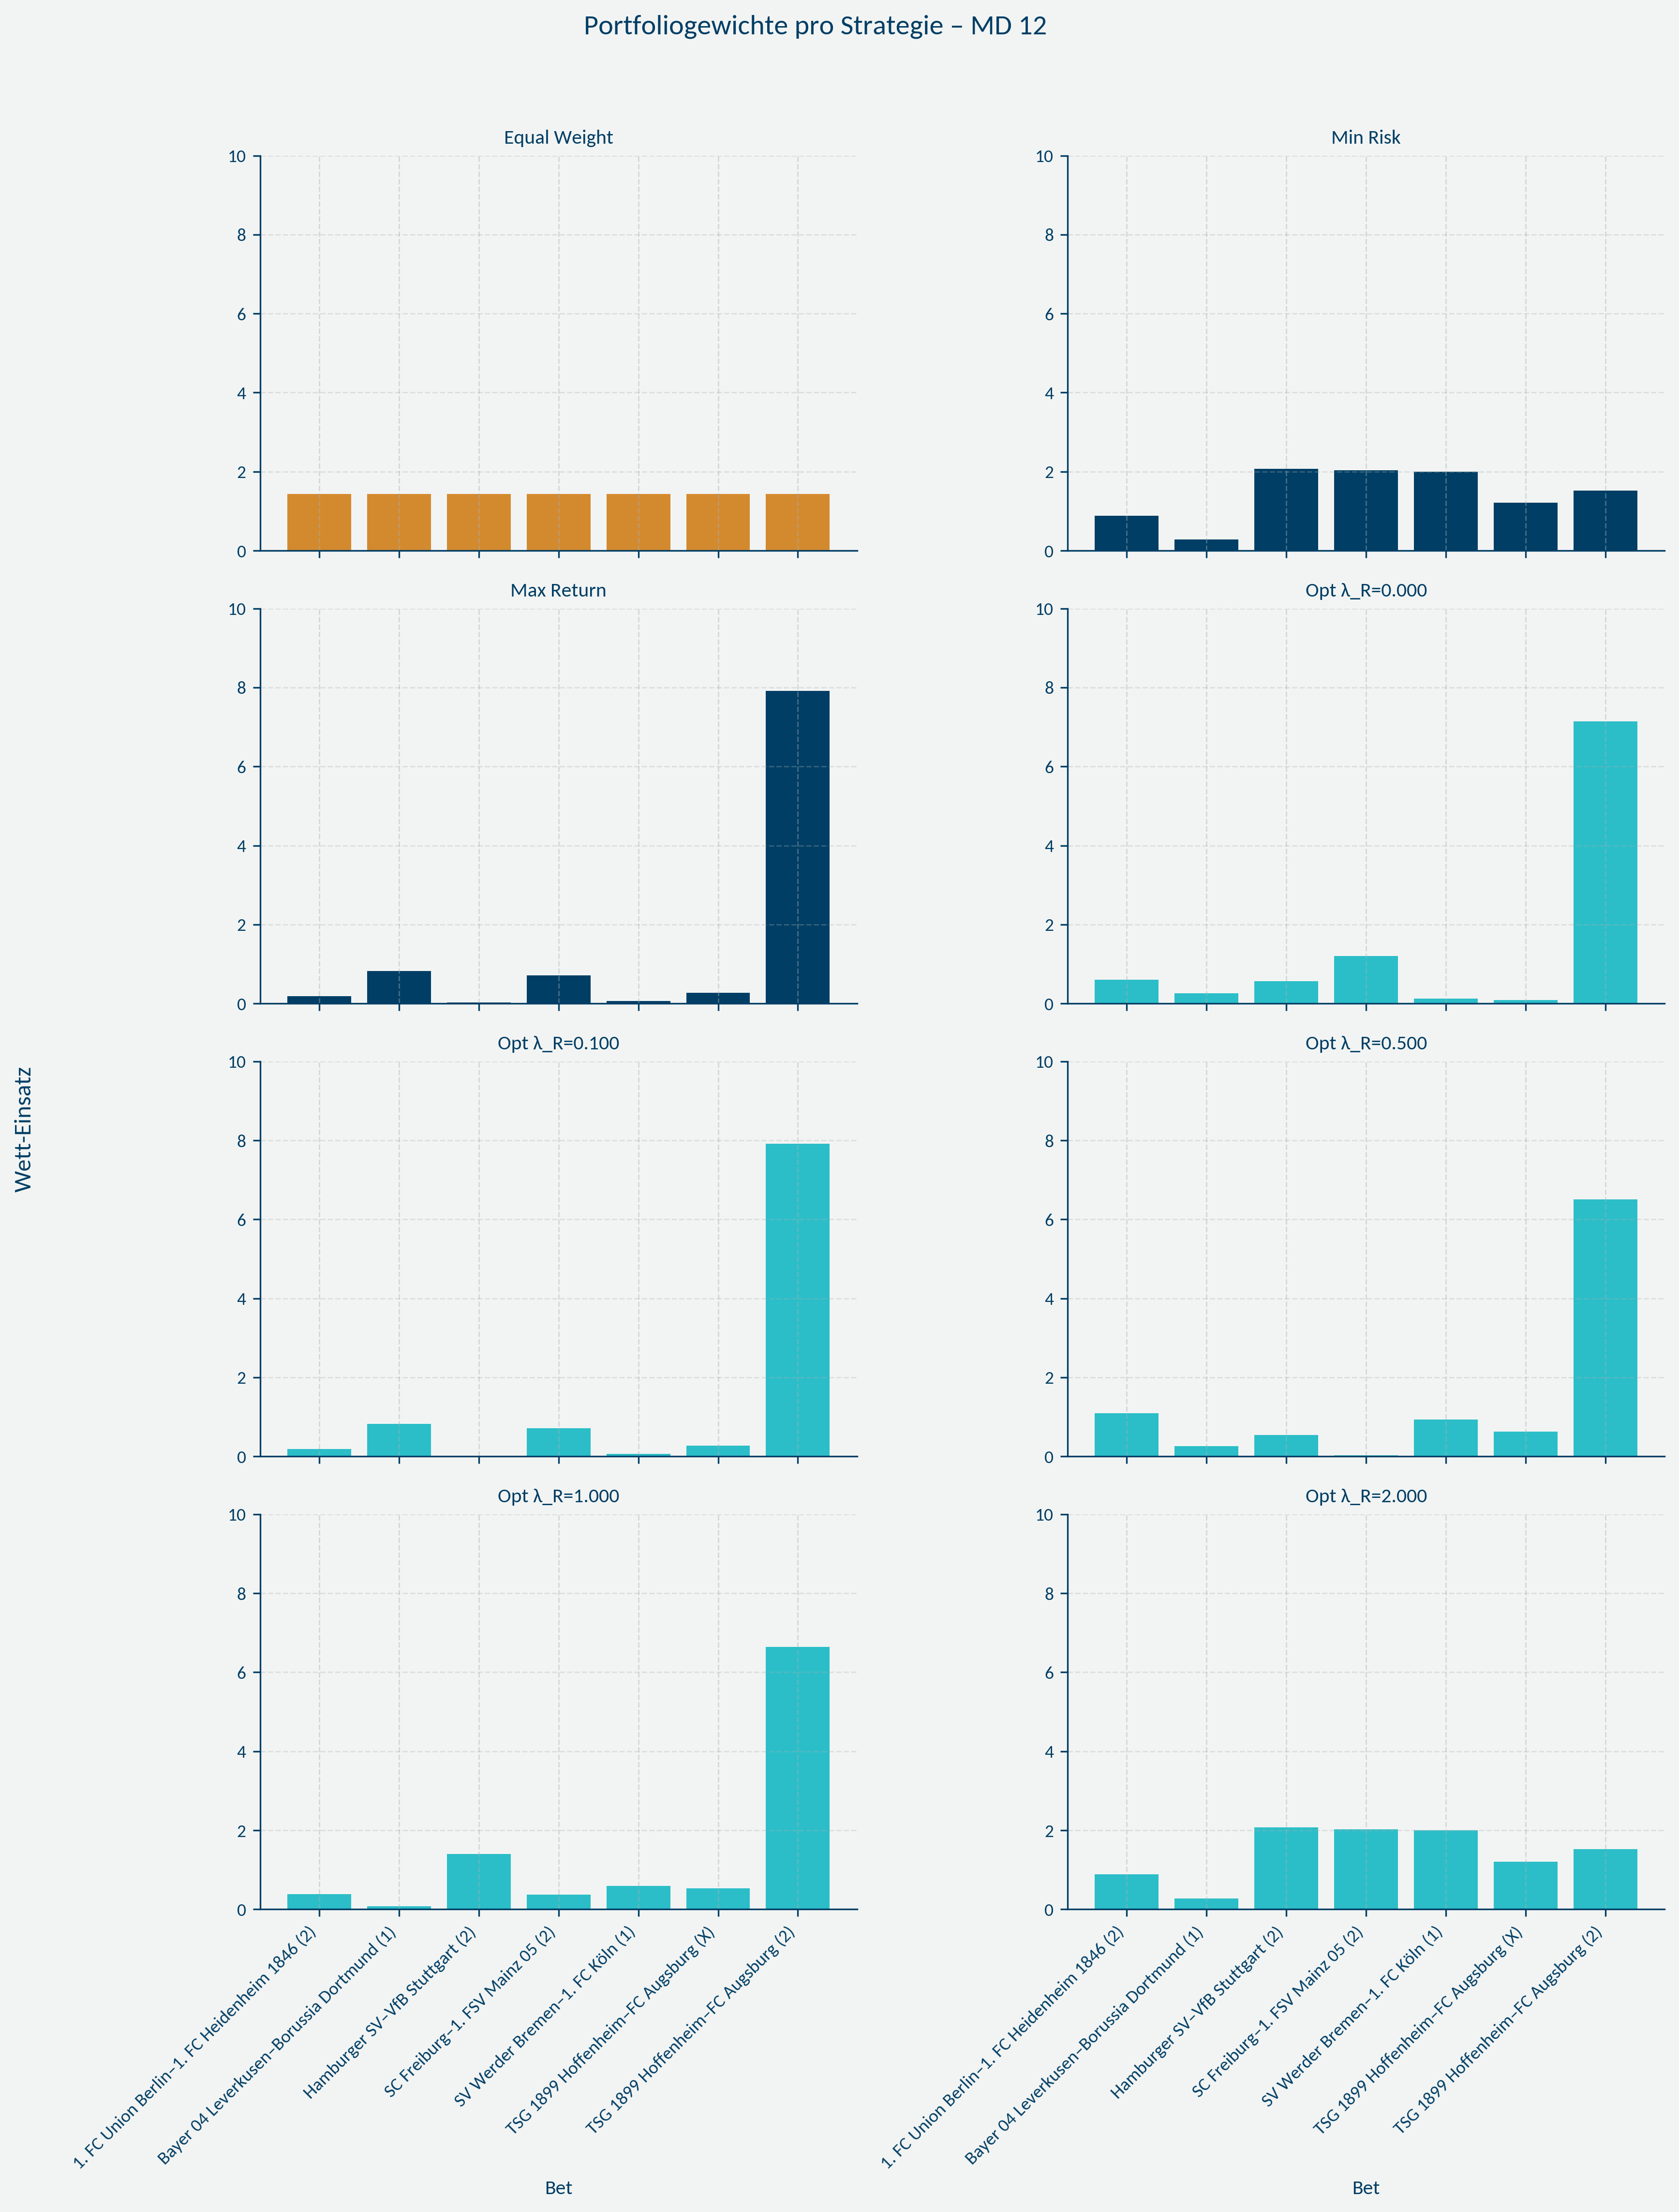
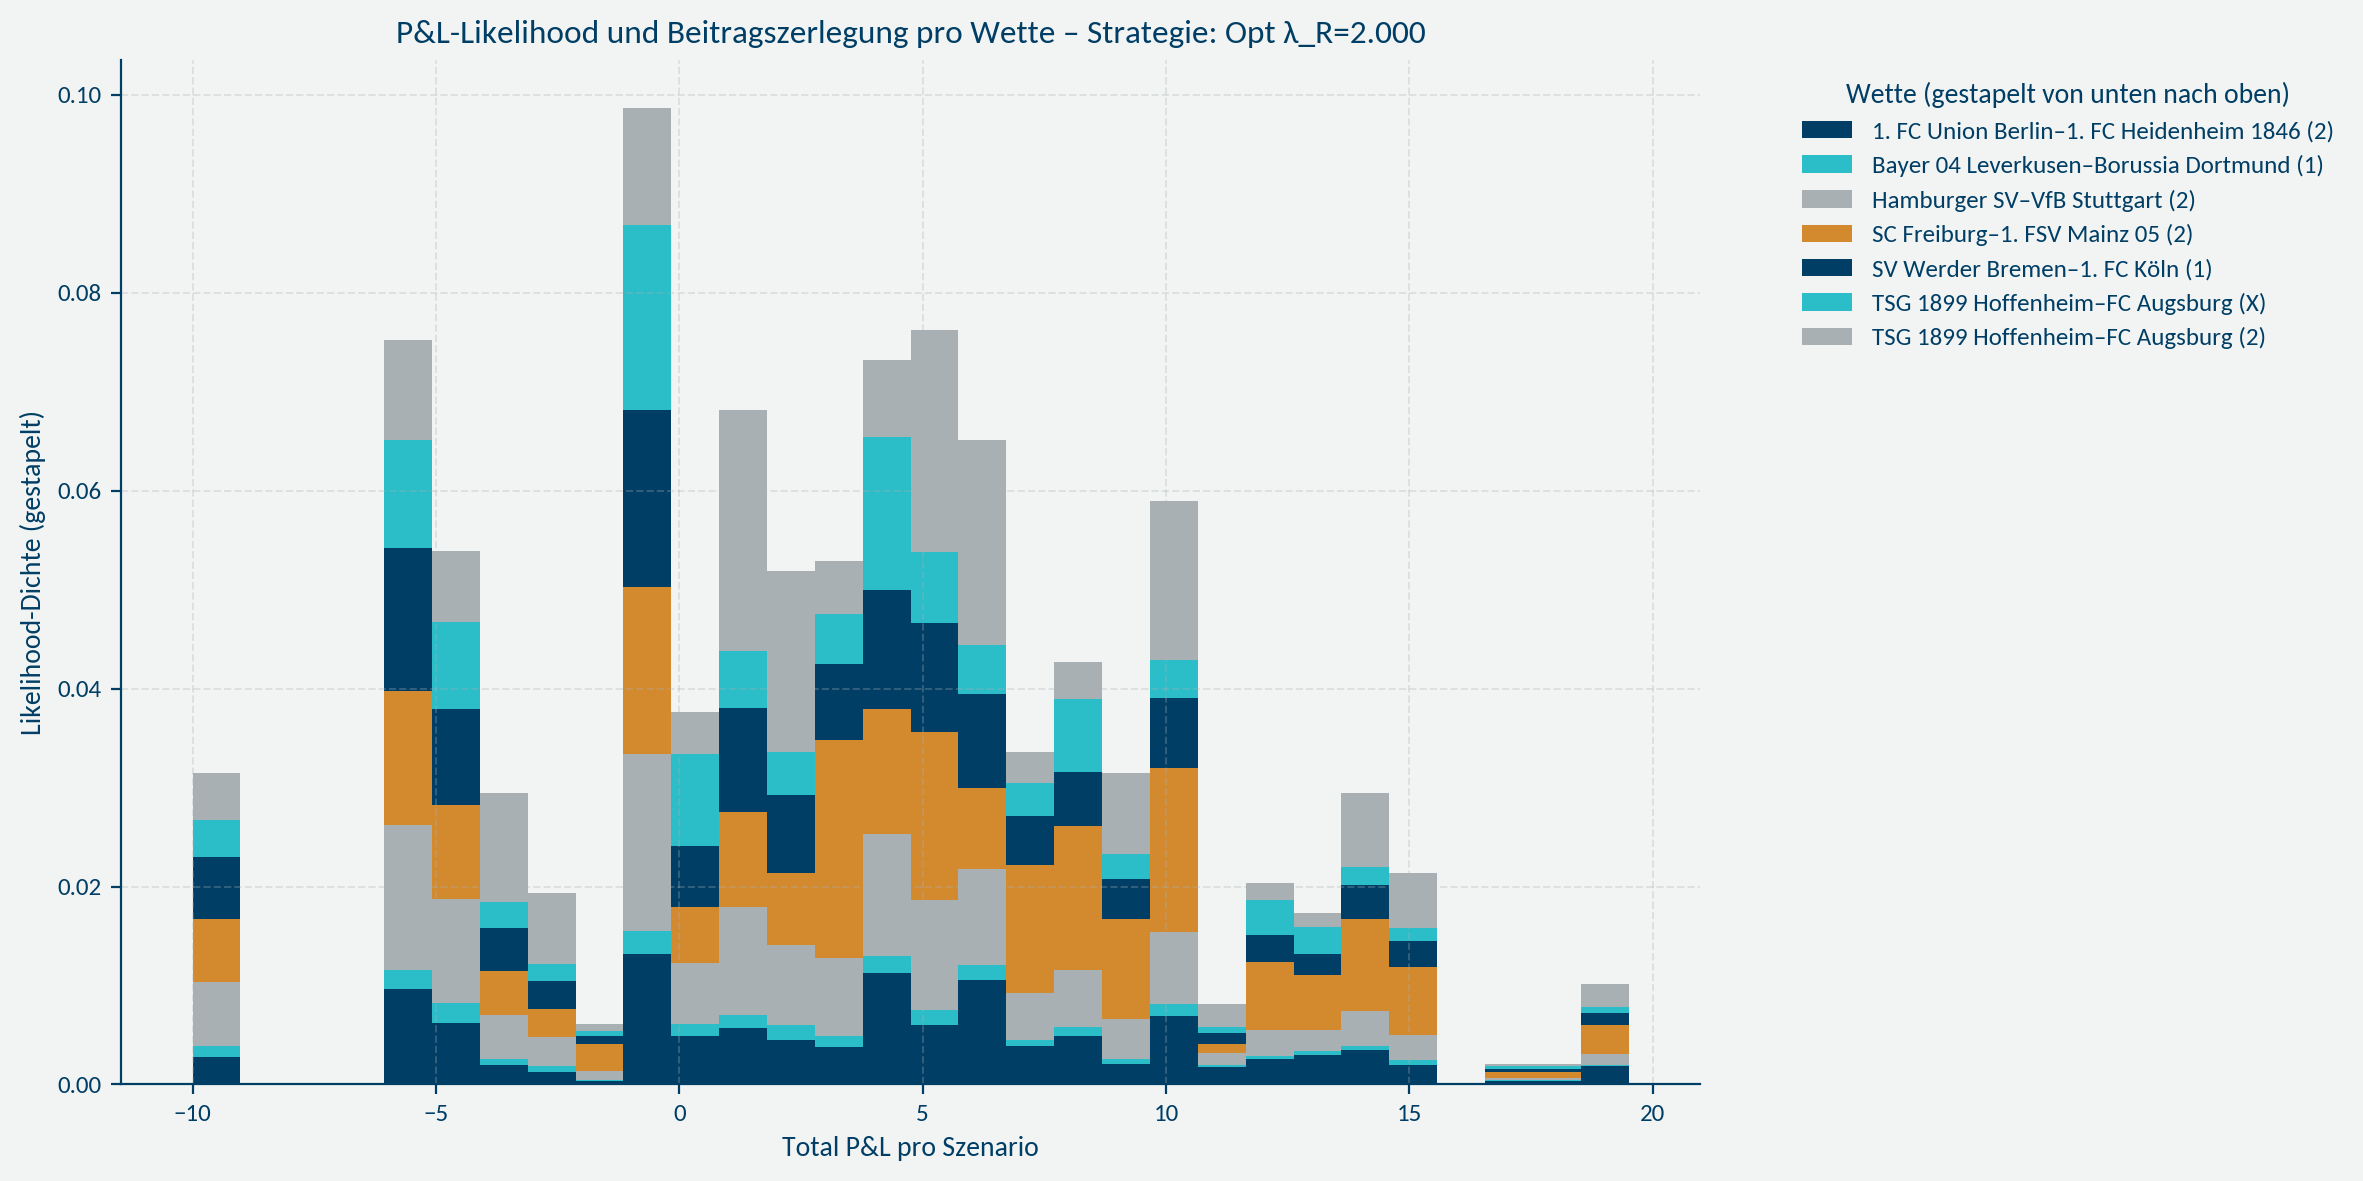
In the SoccerSim Lab, this becomes visible in a controlled setting:</p>
<ul>
  <li>
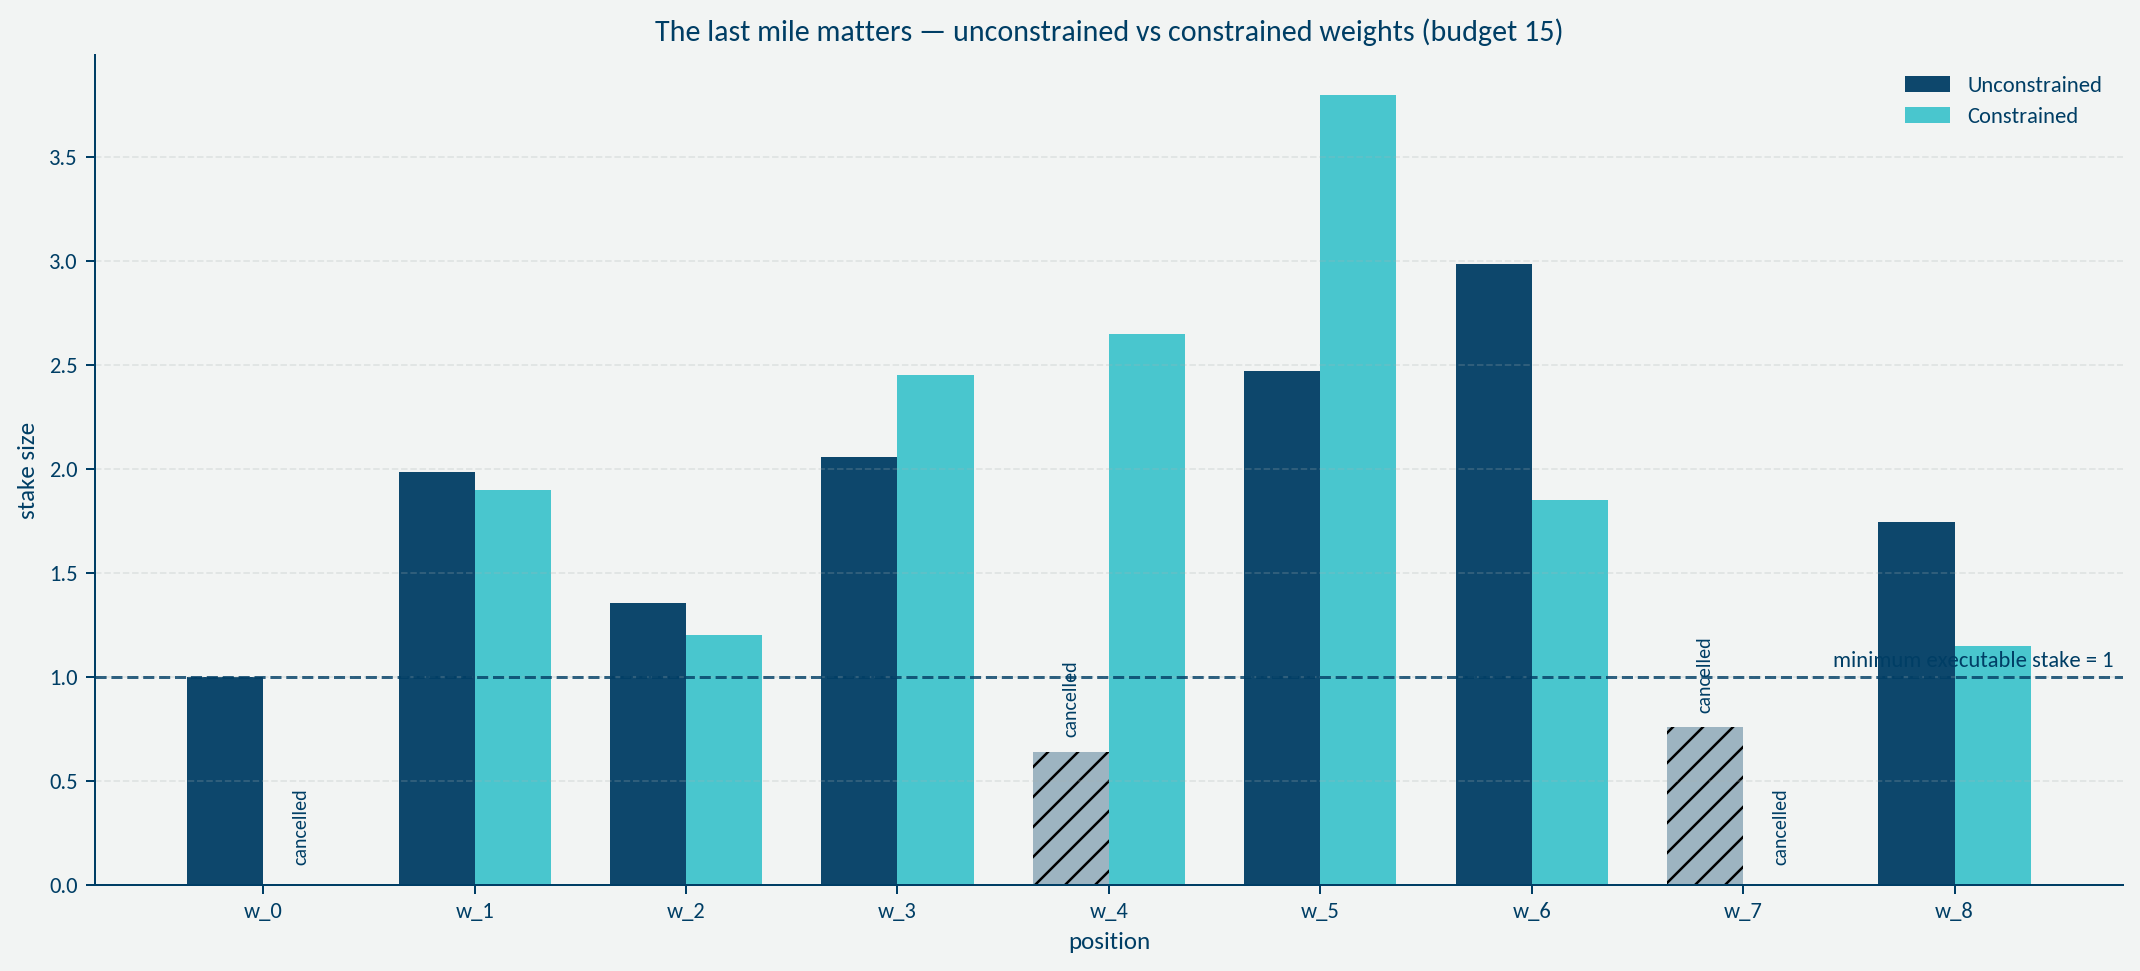
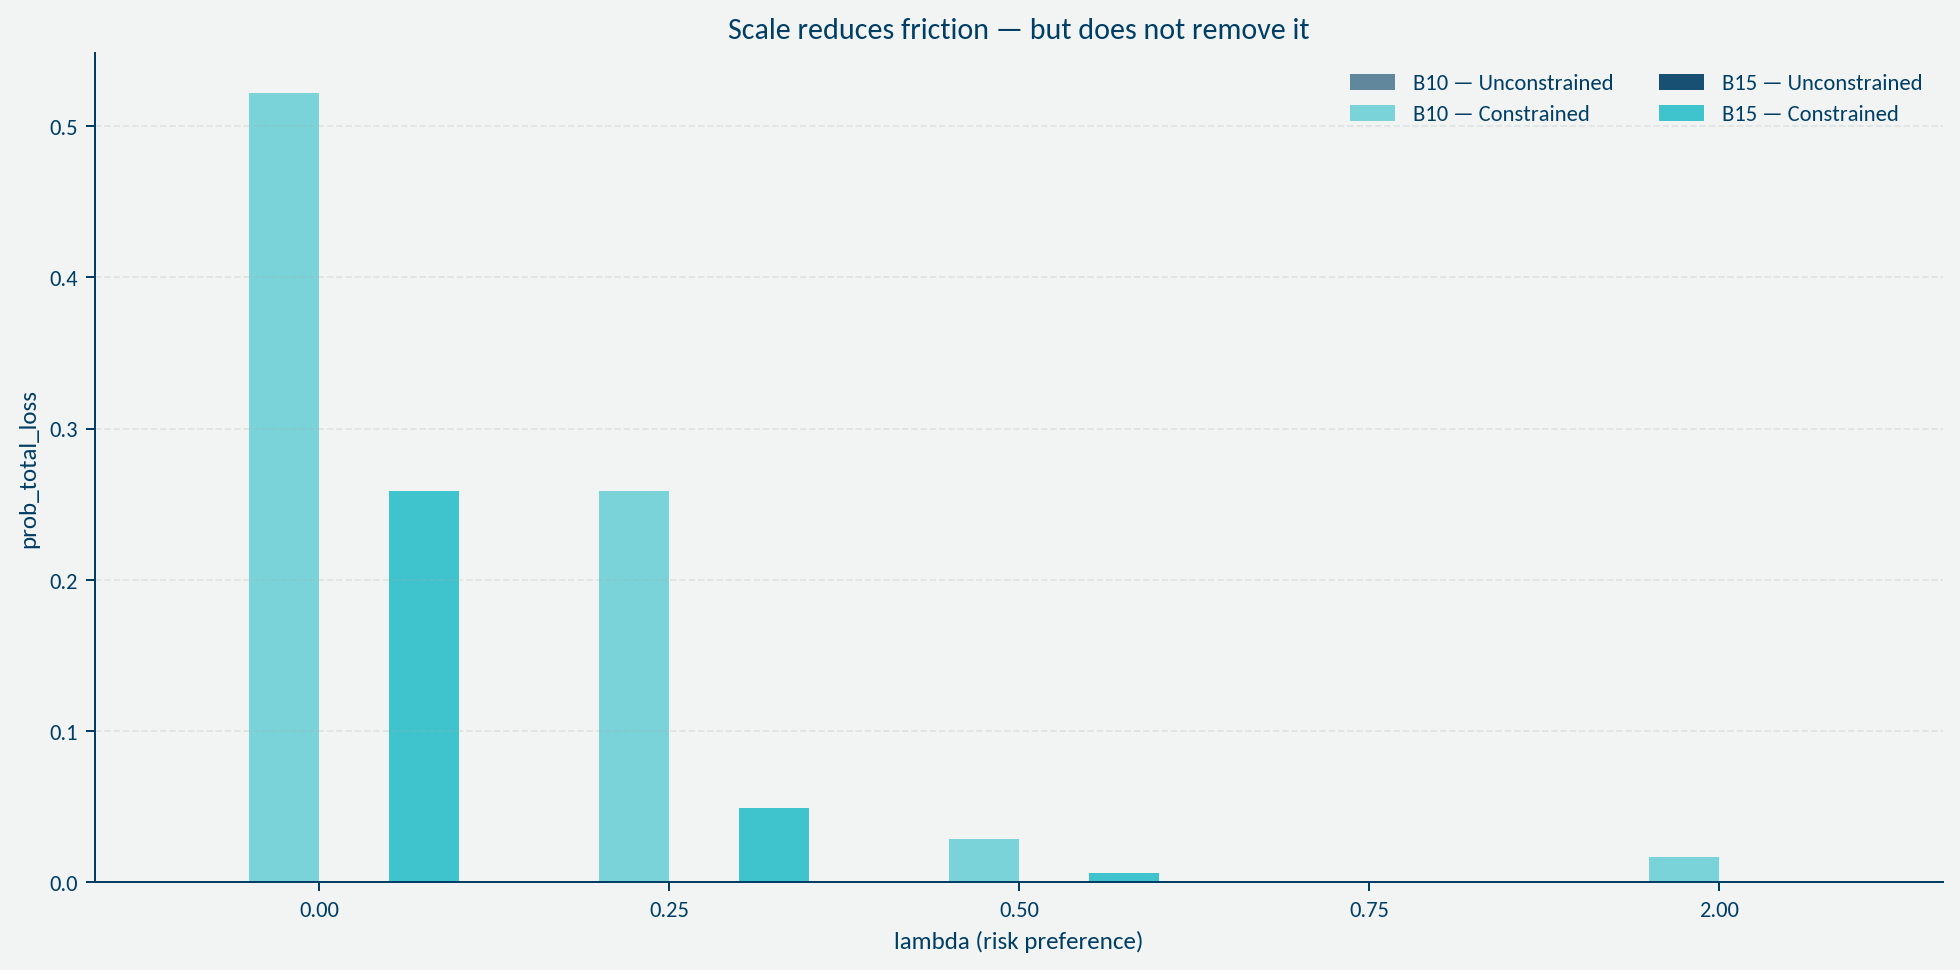
small budgets create strong distortion from minimum sizes</li>
  <li>larger budgets soften friction</li>
  <li>but friction remains a function of risk and never fully disappears</li>
</ul>

<div class="figure-grid two-col">
  <figure class="post-figure">
    <img src="/assets/img/soccersim_frontier_budget10_cvar95_pct_budget.png" alt="Budget 10 efficient frontier under constraints showing distortion in risk-return trade-off" loading="lazy" decoding="async" />
    <figcaption class="caption">
      Budget 10 — efficient frontier distorted under constraints: the feasible decision space shifts.
    </figcaption>
  </figure>

  <figure class="post-figure">
    <img src="/assets/img/soccersim_frontier_budget15_cvar95_pct_budget.png" alt="Budget 15 efficient frontier under constraints showing partial recovery with scale" loading="lazy" decoding="async" />
    <figcaption class="caption">
      Budget 15 — scale shifts the frontier, but does not restore the frictionless optimum.
    </figcaption>
  </figure>
</div>

<p>
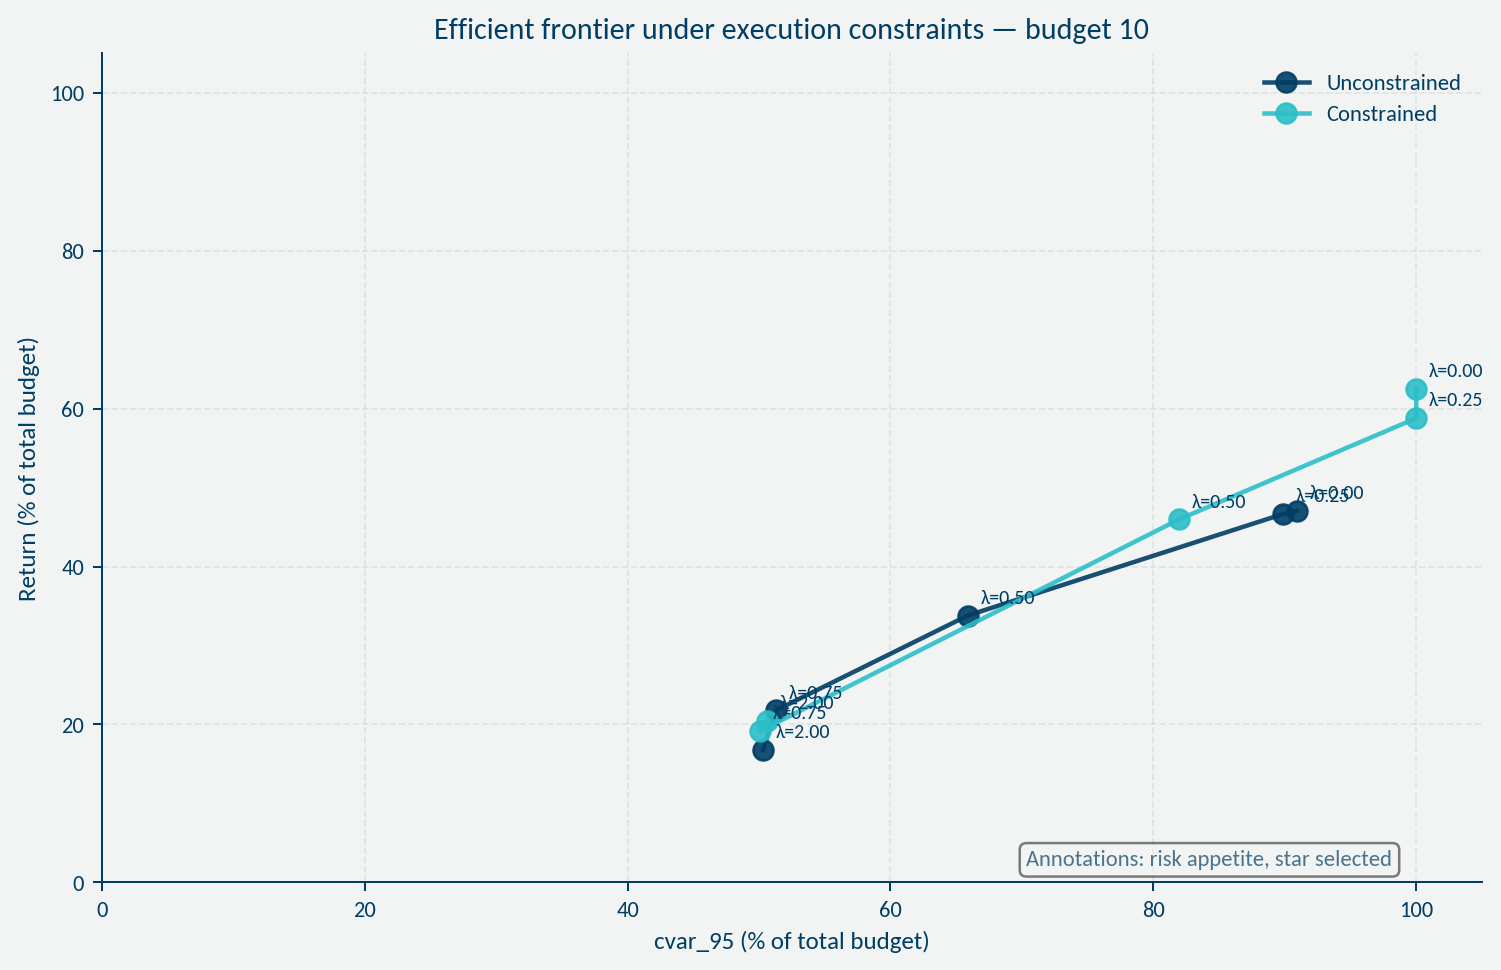
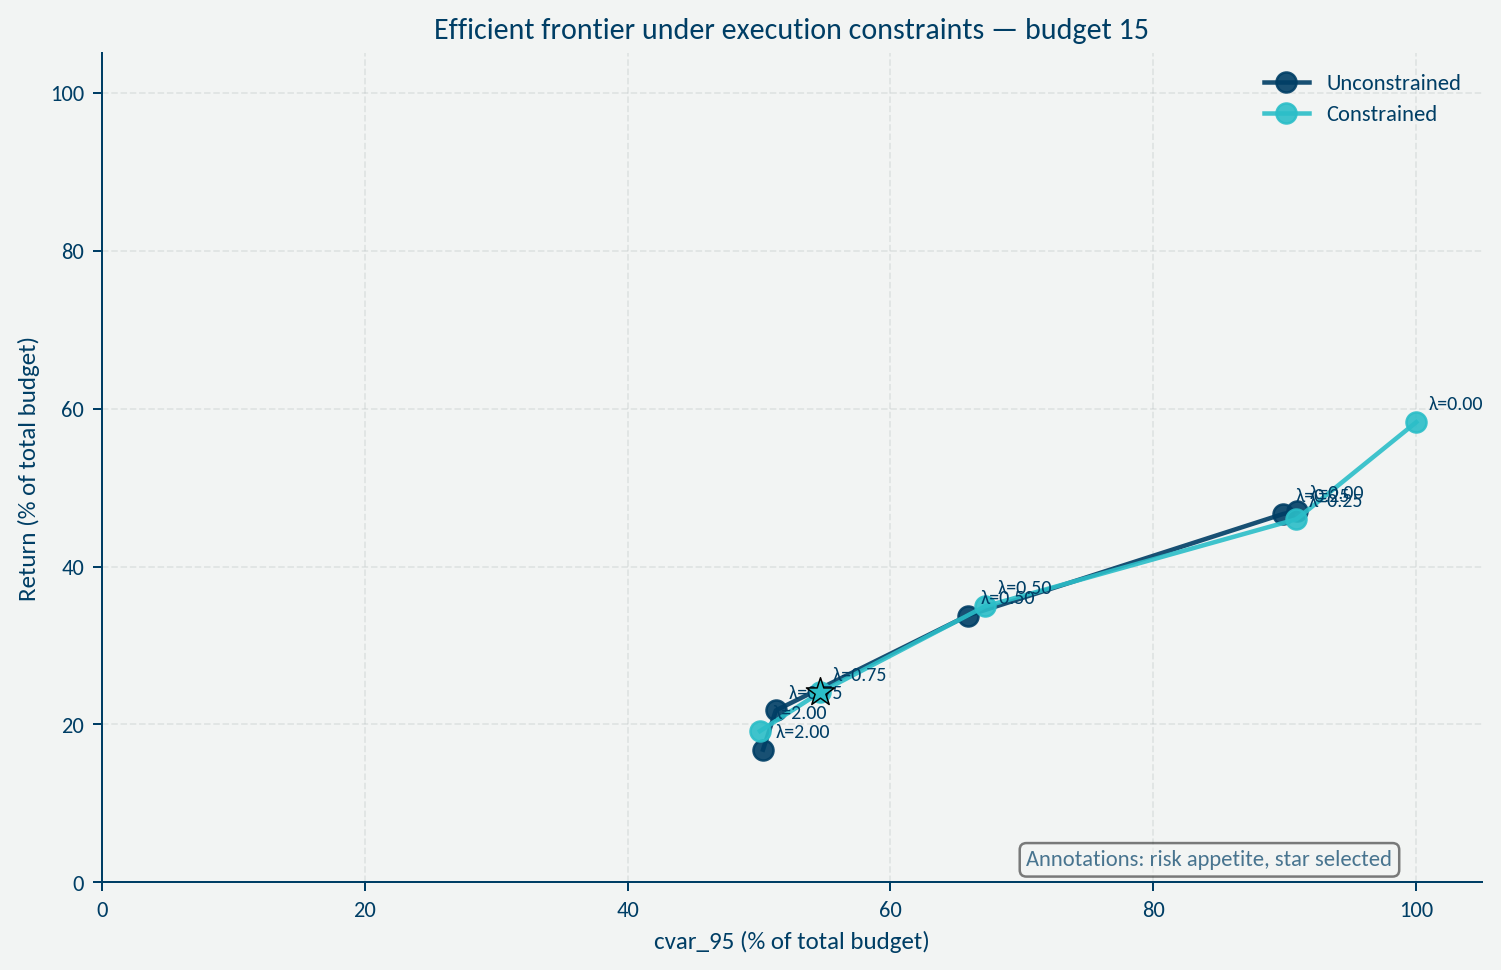
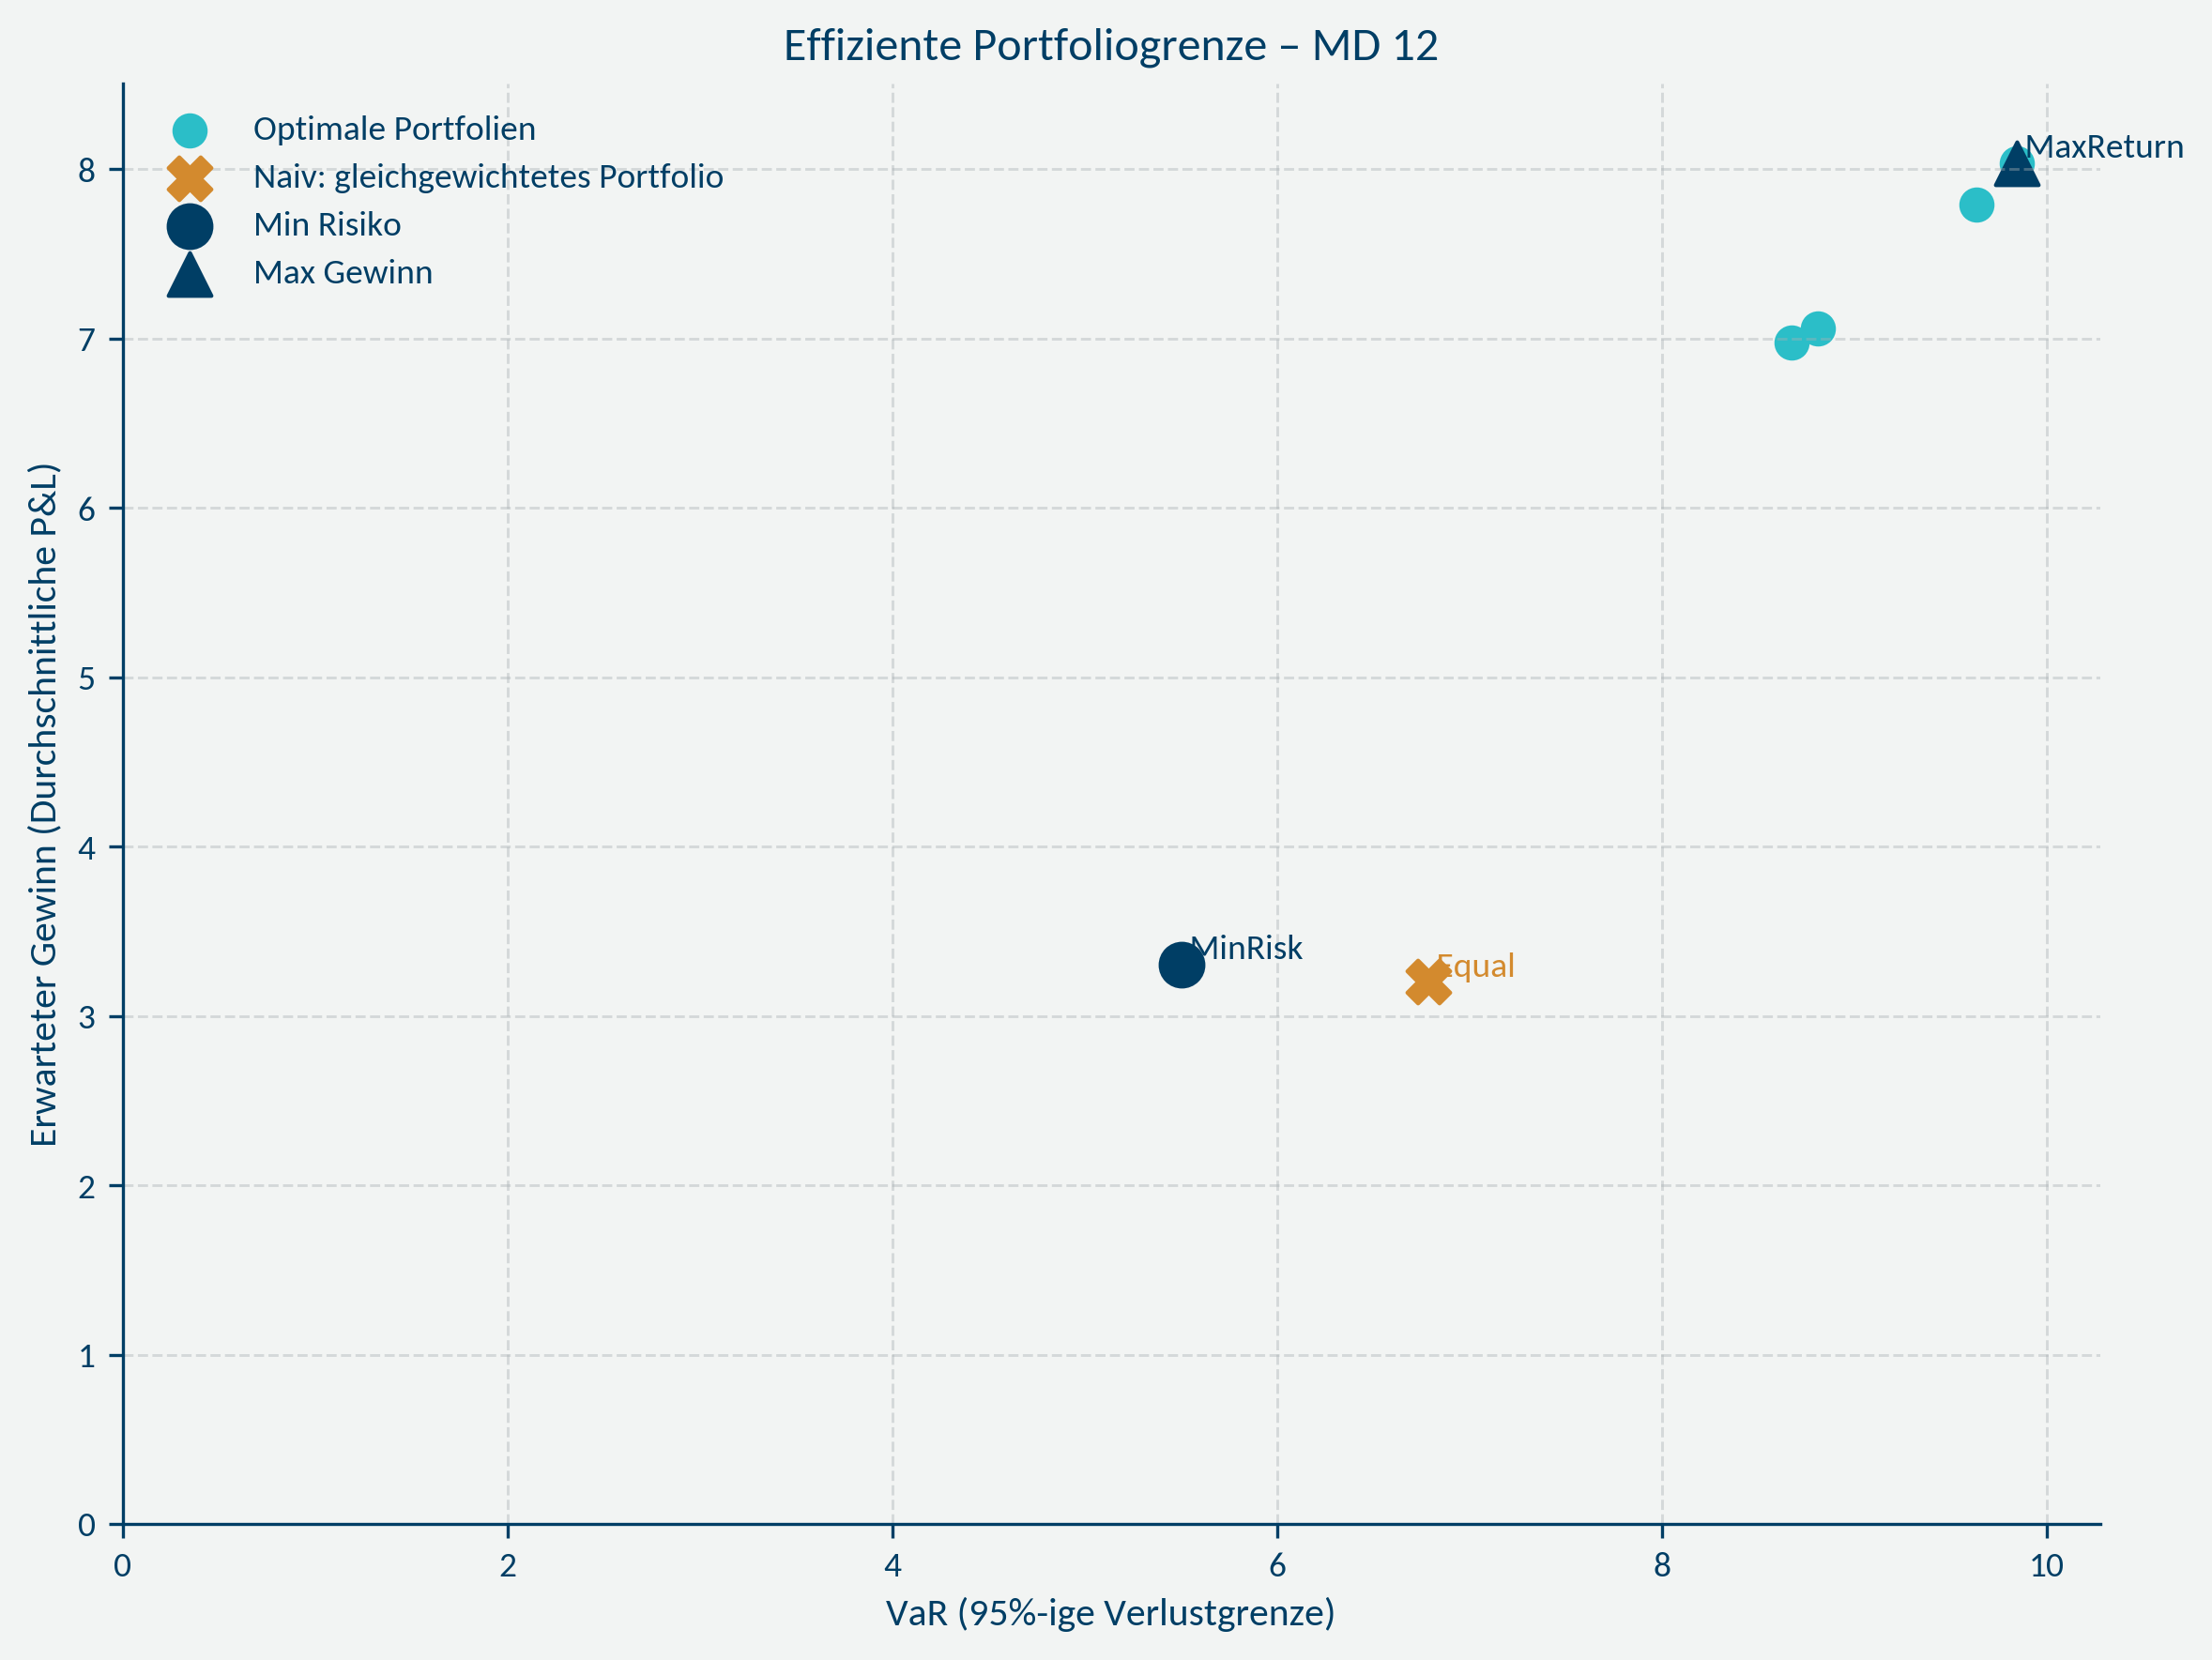
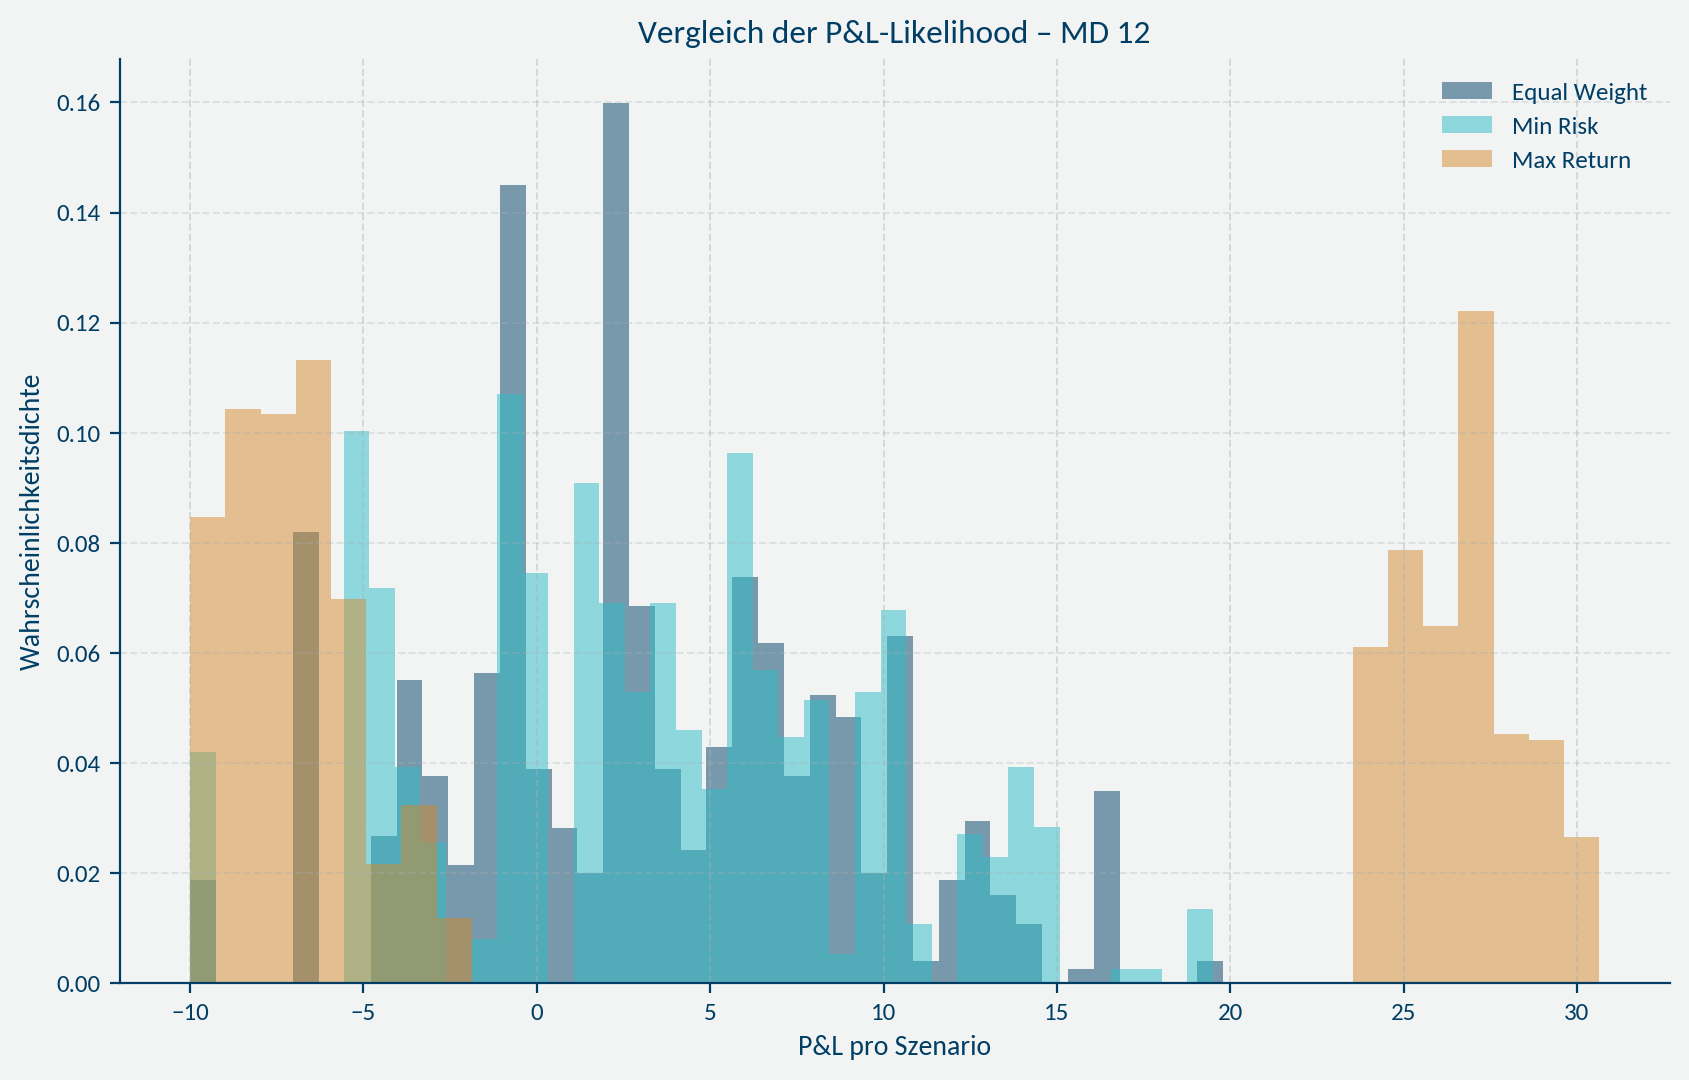
Efficient frontiers become distorted.<br />
Sharpe ratios can still look attractive, while probability of total loss becomes real.
The underlying system has already shifted.</p>

<hr />

<h2 id="in-heavy-tail-business-friction-is-not-marginal">In heavy-tail business, friction is not marginal</h2>

<p>This was the harder part to accept.</p>

<p>I used to think of friction as a second-order effect — something that slightly reduces performance, but does not fundamentally change the outcome, maybe even diversifies away.</p>

<p>That assumption breaks in heavy-tailed and illiquid environments.</p>

<p>There, friction is not additive.<br />
It is multiplicative.<br />
It is systematic.</p>

<div class="figure-grid two-col">
  <figure class="post-figure">
    <img src="/assets/img/soccersim_concentration_tail_10.png" alt="Budget 10 concentration versus tail risk showing structural exposure increase under constraints" loading="lazy" decoding="async" />
    <figcaption class="caption">
      Budget 10 — concentration and tail risk move together under constraints.
    </figcaption>
  </figure>

  <figure class="post-figure">
    <img src="/assets/img/soccersim_concentration_tail_15.png" alt="Budget 15 concentration versus tail risk showing structural exposure even at higher scale" loading="lazy" decoding="async" />
    <figcaption class="caption">
      Budget 15 — scale reduces noise, but structural exposure remains.
    </figcaption>
  </figure>
</div>

<p>It interacts with:</p>
<ul>
  <li>tail events</li>
  <li>timing</li>
  <li>capital lock-in</li>
</ul>

<p>Losses are fully realized.<br />
Gains are only partially captured.<br />
Capital cannot be redeployed freely.</p>

<p>The result is subtle.</p>

<p>
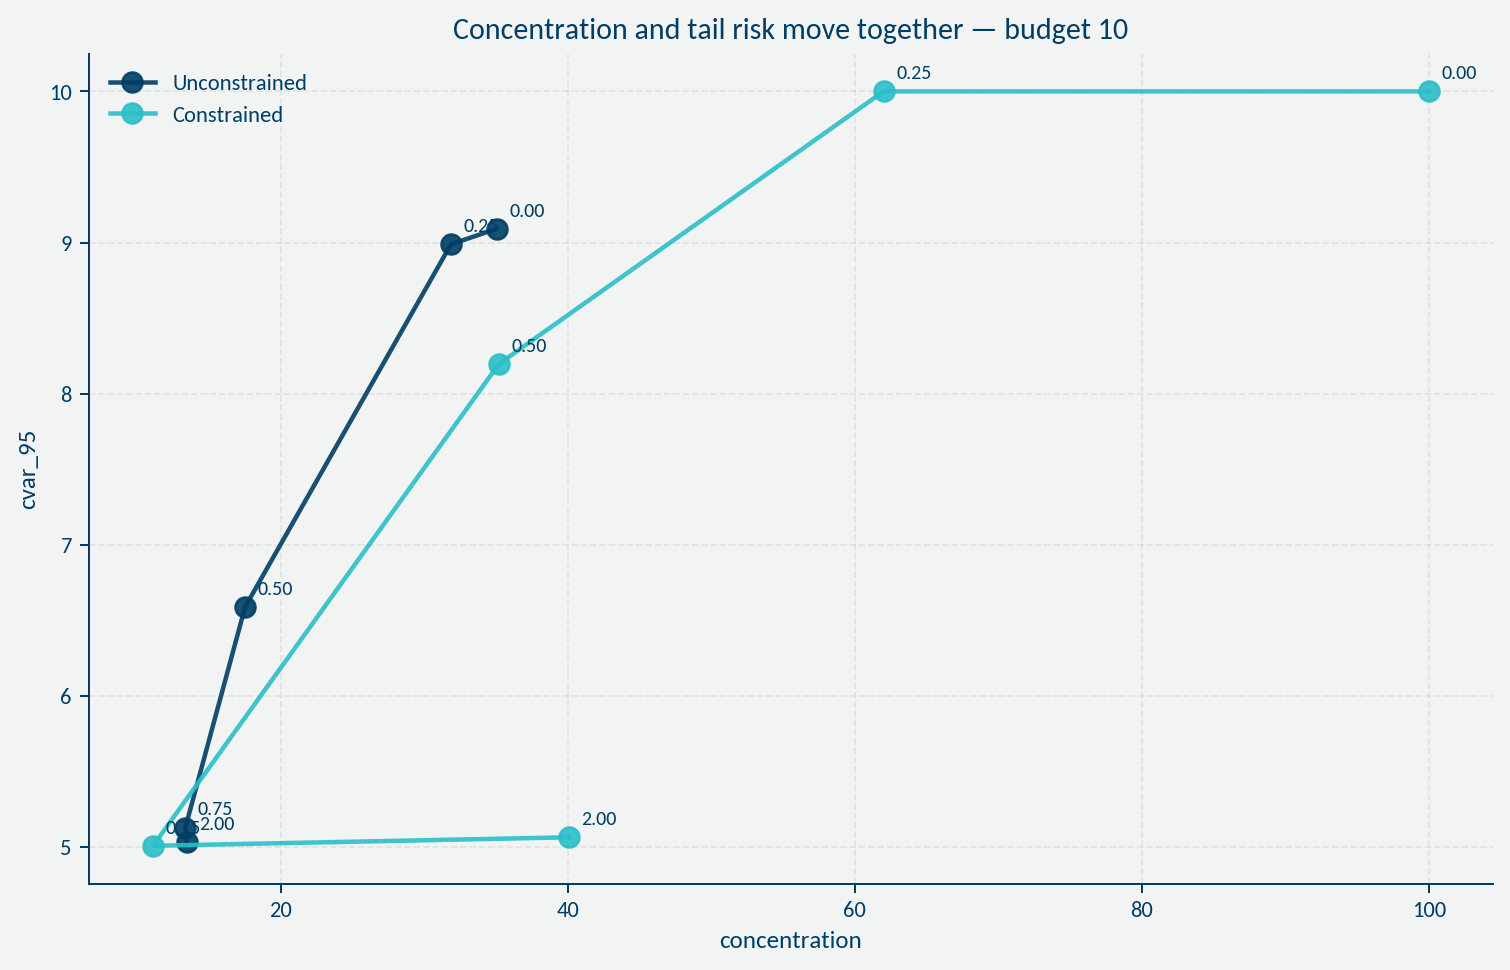
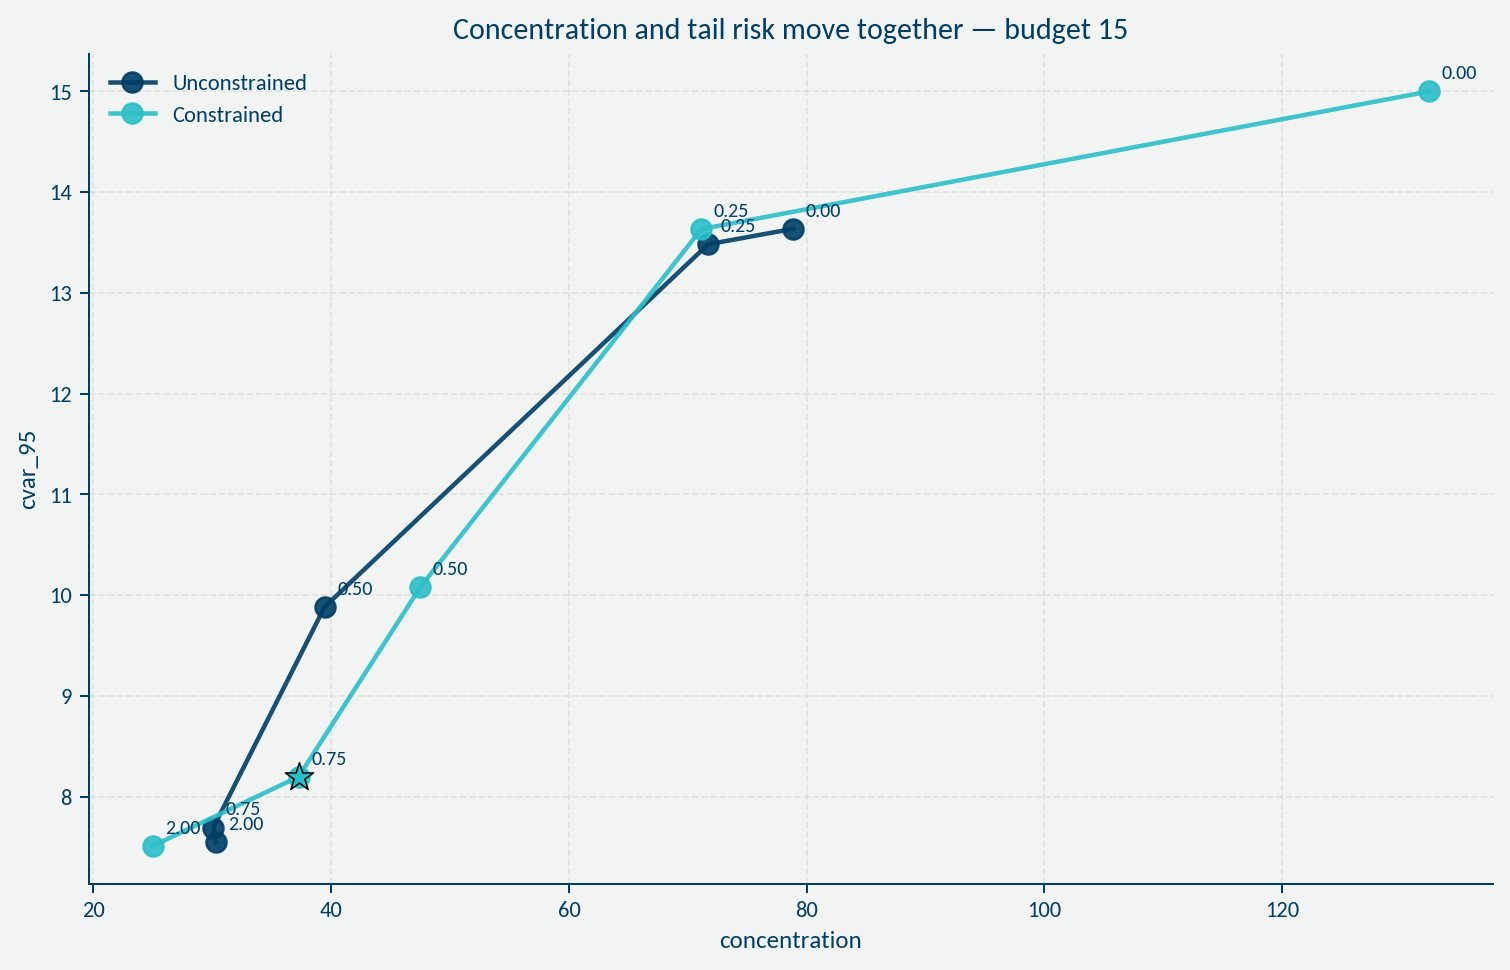
Risk-adjusted metrics can remain stable — while the system becomes less robust. In modern systems, risk-adjusted ratios can mislead. And if the model remains incomplete, concentrations that should normally live inside the model need to be monitored outside it.</p>

<div class="figure-grid two-col">
  <figure class="post-figure">
    <img src="/assets/img/soccersim_risk_adjusted_ratios_mislead_10.png" alt="Budget 10 Sharpe versus tail risk showing stable ratios despite structural deterioration" loading="lazy" decoding="async" />
    <figcaption class="caption">
      Budget 10 — risk-adjusted ratios appear stable while structure deteriorates.
    </figcaption>
  </figure>

  <figure class="post-figure">
    <img src="/assets/img/soccersim_risk_adjusted_ratios_mislead_15.png" alt="Budget 15 Sharpe versus tail risk showing misleading stability of performance metrics" loading="lazy" decoding="async" />
    <figcaption class="caption">
      Budget 15 — even with scale, ratios can mislead about underlying risk.
    </figcaption>
  </figure>
</div>

<p>Frictions obscure the boundary between what is acceptable — and what is actually admissible.</p>

<hr />

<h2 id="in-practice-friction-is-often-no-longer-treated-as-a-first-class-decision-variable">In practice, friction is often no longer treated as a first-class decision variable</h2>

<p>Another uncomfortable realization followed.</p>

<p>We moved from a world where friction was priced to a world where it is assumed away.</p>

<p>Earlier frameworks made these effects explicit. Under Solvency II and IFRS 17, friction is no longer priced as a first-class quantity. At best, traces remain through proxies such as expenses, delayed profit emergence, and non-hedgeable uncertainty. But capital lock-in, deployment constraints, model divergence, and underwriting discreteness are not made explicit as decision variables.</p>

<p>These effects need to be made explicit in decisions.<br />
Otherwise, the consequence is subtle — but structural.</p>

<p>Risk-adjusted metrics still look clean.<br />
Portfolios still appear efficient.<br />
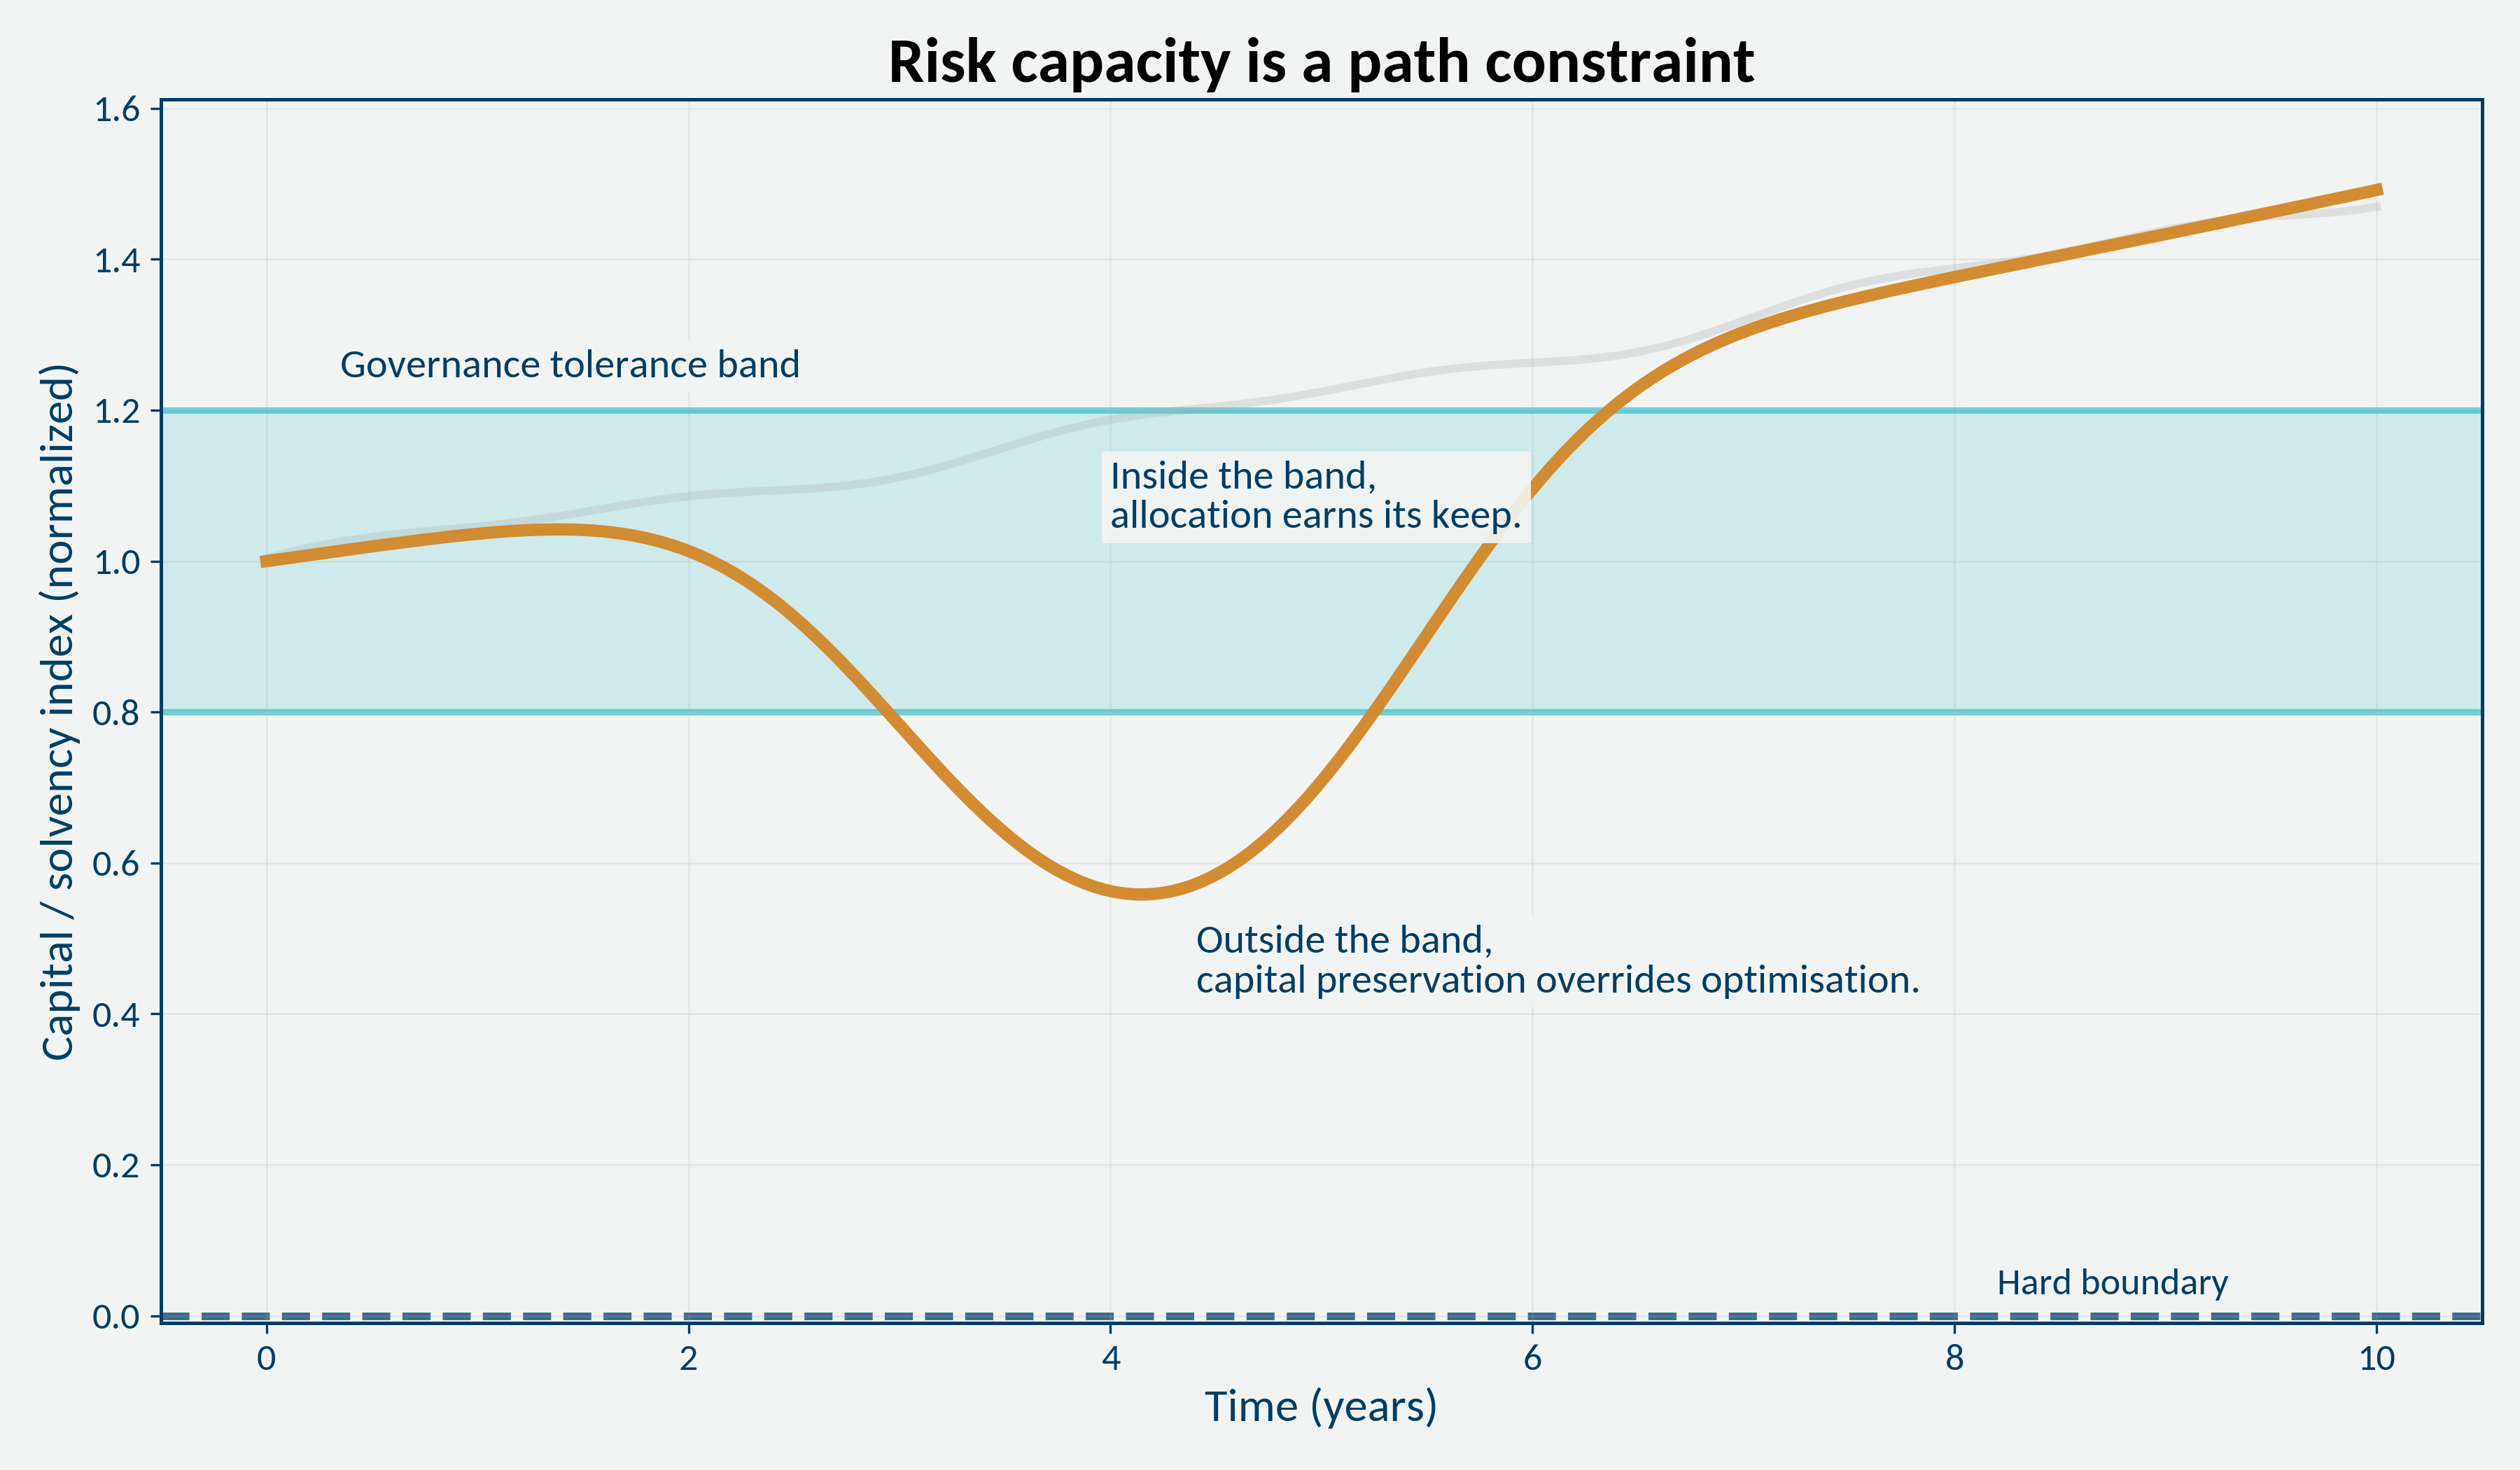
But the boundary shifts.</p>

<figure class="post-figure">
  <img src="/assets/img/soccersim_scale_reduces_friction_total_loss.png" alt="Effect of scale on probability of total loss showing that friction persists even with higher budget" loading="lazy" decoding="async" />
  <figcaption class="caption">
    In this case, scale reduces friction — but does not remove it. Tail risk remains a structural constraint.
  </figcaption>
</figure>

<p>Not every acceptable risk is an admissible strategy. In my case, both growth and careful review of the risk appetite beyond Sharpe stabilized the strategy — and ultimately compressed the signal.</p>

<p>If friction is not modeled explicitly, you risk remaining blind on one eye. Having an edge is not enough. Examining friction will tell whether growth, diversification, or shaping the market &amp; underwriting discipline is the appropriate strategic option.</p>

<p>That is where the augmented actuary operates — not just on models, but on the system they live in.</p>

<hr />

<h2 id="if-you-dont-see-friction-look-here">If you don’t see friction, look here</h2>

<p>A final observation from the SoccerSim Lab.</p>

<p>Friction is not something you “see” in a model.<br />
It is something you recognize in the system.<br />
And it usually shows up indirectly — only then can it be understood.</p>

<p>A few symptoms to look for:</p>
<ul>
  <li>leakage in P&amp;L</li>
  <li>underwriting diverges from plan</li>
  <li>stable capital optimization, but weak capital generation</li>
  <li>robust risk appetite — on paper</li>
  <li>concentration and risk model out of sync</li>
  <li>surprises in actual capital requirements</li>
  <li>value management becomes ambiguous</li>
  <li>models are not used for strategic options</li>
</ul>

<p>These are not isolated issues. They are signals.</p>

<p>Signals that friction is present — but not explicitly modeled. And once you see them together, the implication is clear:</p>

<p>You are not optimizing your portfolio.<br />
You are optimizing a simplified version of it.</p>

<p>I ran this diagnostic on my own setup.</p>

<p>Ultimately, it increased confidence in both growth in scale and higher risk appetite. I selected a portfolio where frictions are under control ex ante: the two worlds remain close, the KPIs coexist, and trust increases (see table).</p>

<table>
  <thead>
    <tr>
      <th> </th>
      <th style="text-align: right">Unconstrained</th>
      <th style="text-align: right">Constrained</th>
    </tr>
  </thead>
  <tbody>
    <tr>
      <td>Expected return</td>
      <td style="text-align: right">21.8%</td>
      <td style="text-align: right"><strong>24.1%</strong></td>
    </tr>
    <tr>
      <td>VaR (95%)</td>
      <td style="text-align: right">37.2%</td>
      <td style="text-align: right">39.9%</td>
    </tr>
    <tr>
      <td>CVaR (95%)</td>
      <td style="text-align: right">51.3%</td>
      <td style="text-align: right">54.6%</td>
    </tr>
    <tr>
      <td>Probability of total loss</td>
      <td style="text-align: right">0.0%</td>
      <td style="text-align: right">0.0%</td>
    </tr>
    <tr>
      <td>Sharpe (VaR)</td>
      <td style="text-align: right">0.59</td>
      <td style="text-align: right"><strong>0.60</strong></td>
    </tr>
    <tr>
      <td>Sharpe (CVaR)</td>
      <td style="text-align: right">0.42</td>
      <td style="text-align: right"><strong>0.44</strong></td>
    </tr>
    <tr>
      <td>Concentration</td>
      <td style="text-align: right">30.1%</td>
      <td style="text-align: right"><strong>37.3%</strong></td>
    </tr>
  </tbody>
</table>

<p>That changed my perspective.</p>

<p>Once friction was made explicit, the decision became more robust — not less. The model did not lose relevance. It gained context, and capital can be deployed with confidence.</p>

<p>Ultimately, higher volume and risk appetite will also improve the financial outcome of the strategy in the long run.</p>

<hr />

<h2 id="executive-takeaway">Executive takeaway</h2>

<p>The point is not that models fail.</p>

<p>
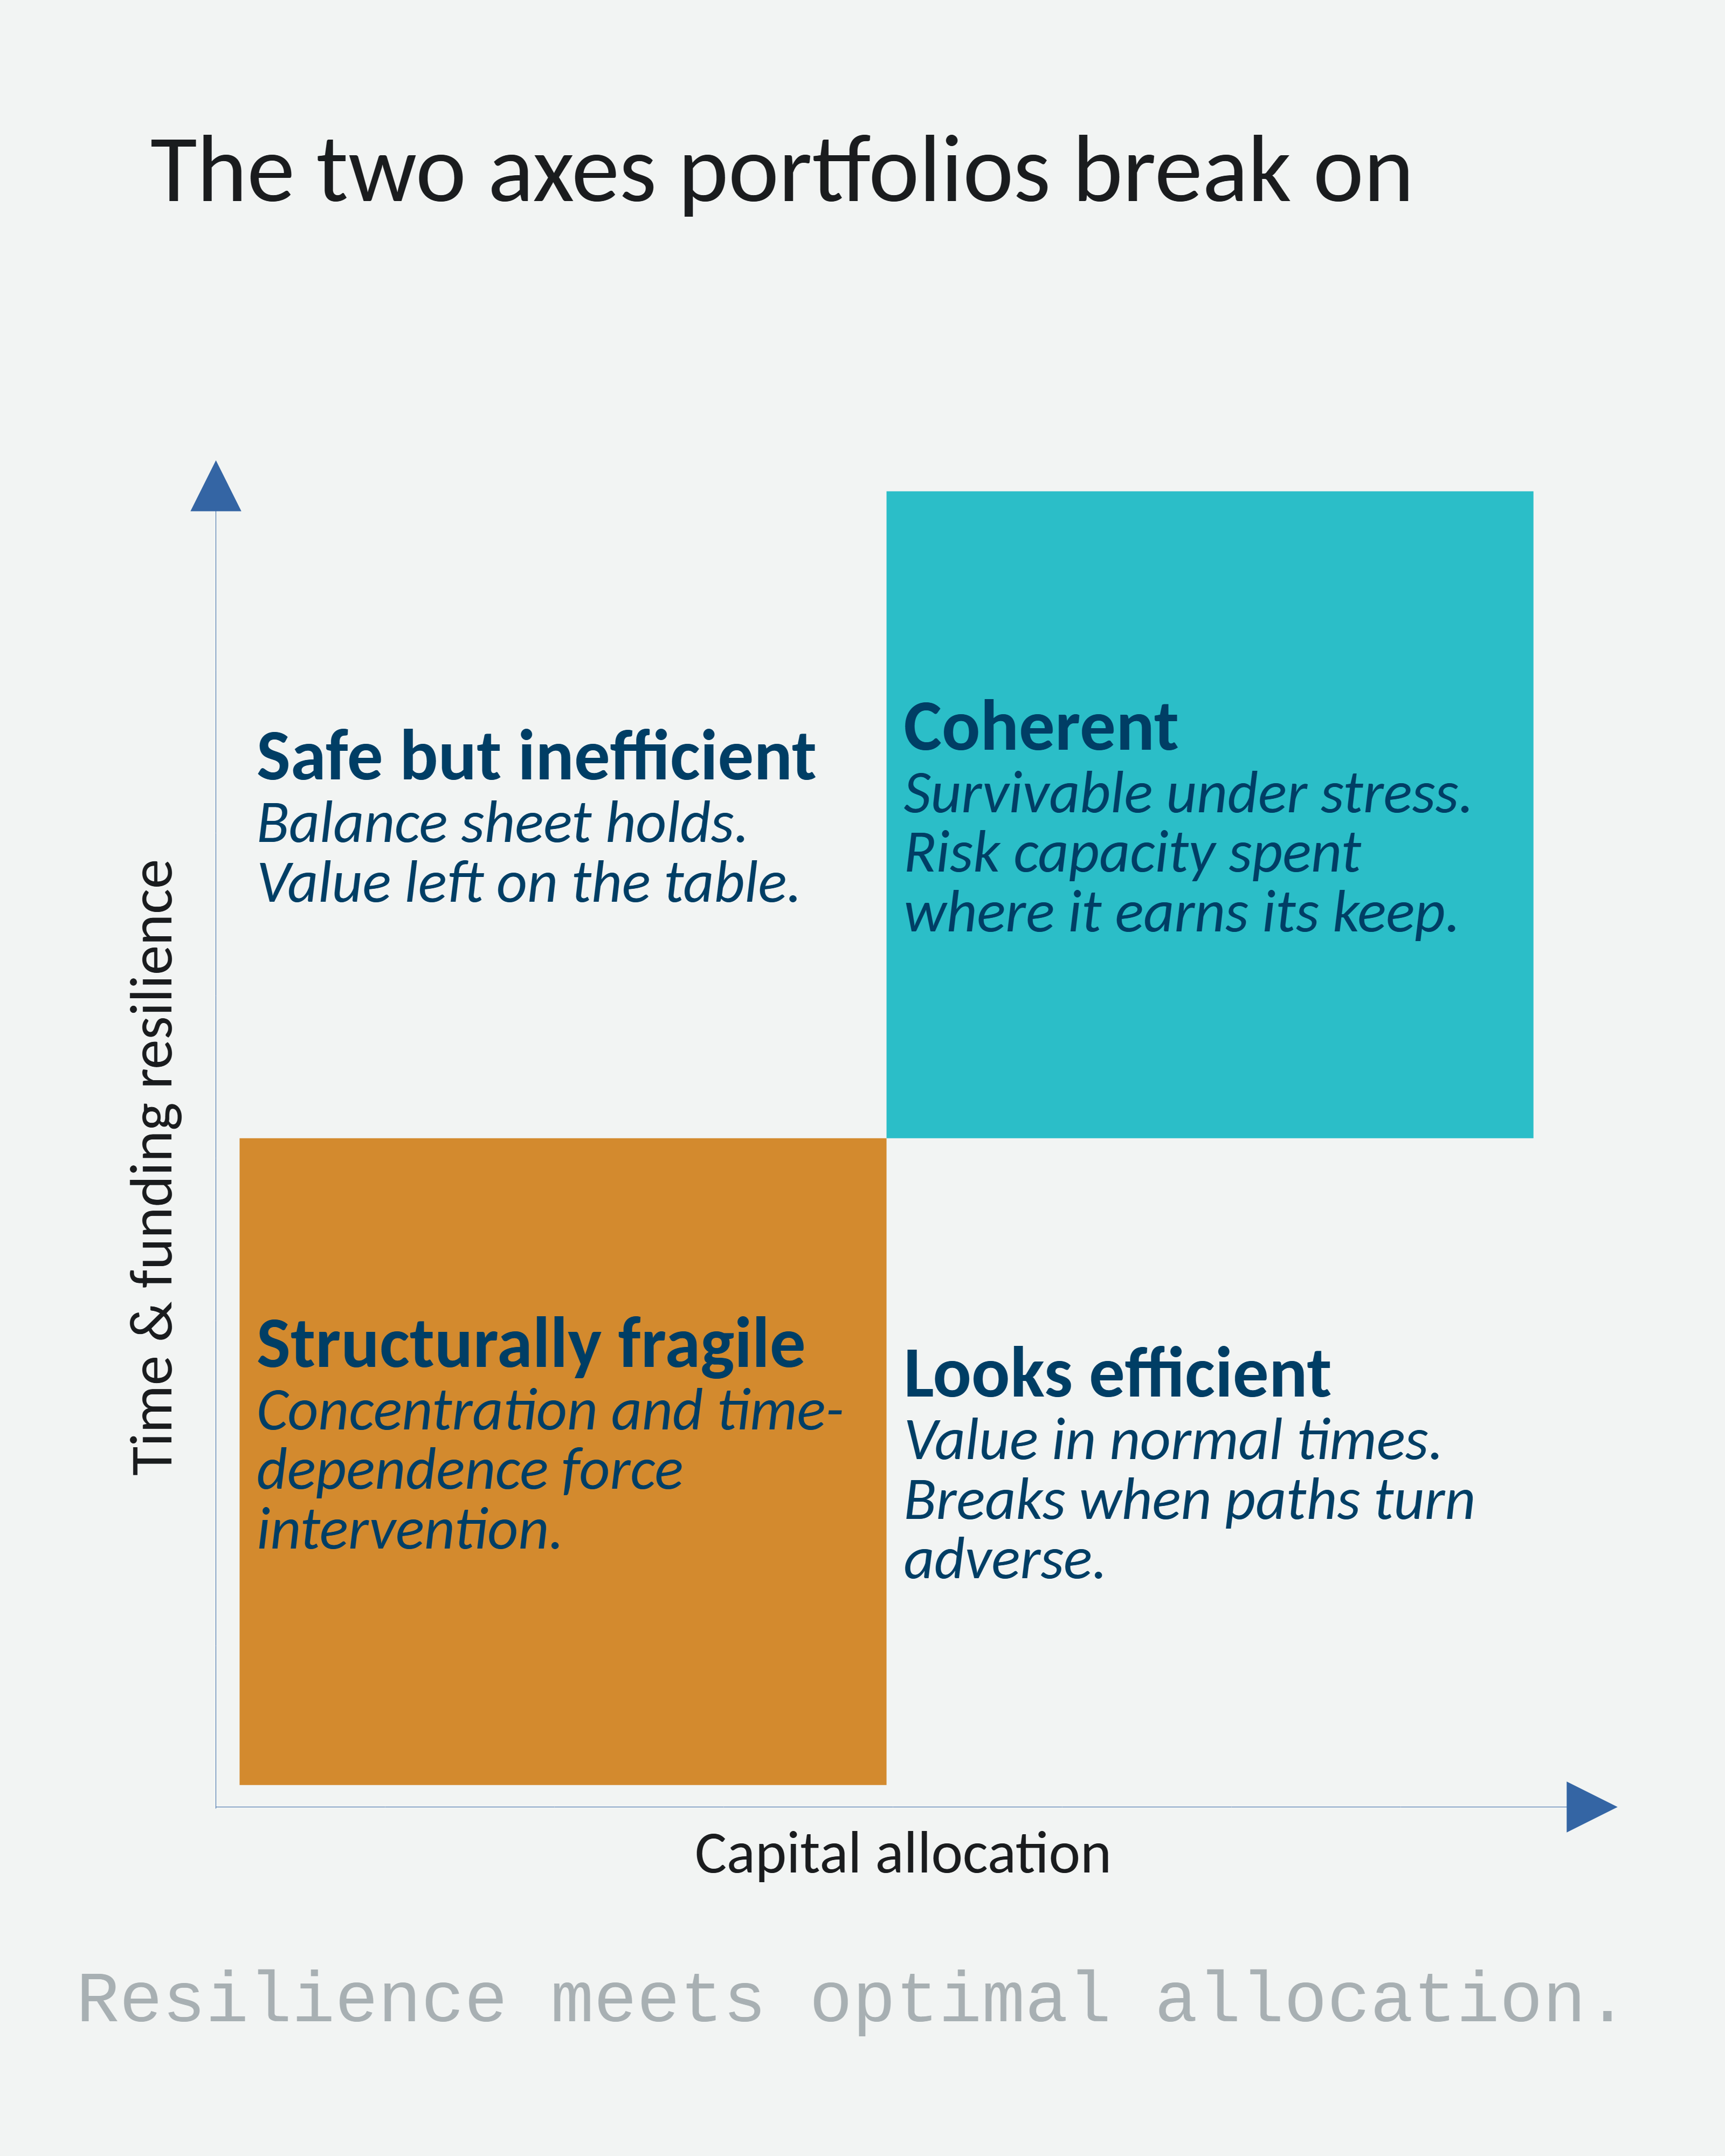
The point is that friction changes the structure of decisions.</p>

<p>In a frictionless world, optimization is clean.
In the real world, admissibility matters — risk appetite must hold in practice.</p>

<p>Careful analysis reveals the strategic options:
growth, diversification, or shaping the market through market building and underwriting discipline.</p>

<p>What this case changed for me was not the model —
but the confidence in the decision once friction had been made explicit.</p>

<p>For once, growth and increased risk appetite remunerate courage in the right place.</p>

<p>Confidence does not come from better models alone.
It comes from making the system explicit.</p>

<hr />

<p>
Tags:

<a href="/tags/risk/">risk</a>, 

<a href="/tags/insurance/">insurance</a>, 

<a href="/tags/reinsurance/">reinsurance</a>, 

<a href="/tags/portfolio-thinking/">portfolio-thinking</a>, 

<a href="/tags/decision-labs/">decision-labs</a>

</p>]]></content><author><name>Bernhard von Boyen</name></author><category term="risk" /><category term="insurance" /><category term="reinsurance" /><category term="portfolio-thinking" /><category term="decision-labs" /><summary type="html"><![CDATA[Nothing looked wrong in the model. And yet, the system behaved differently. A SoccerSim Lab case on friction, admissibility, and decision confidence under real constraints.]]></summary></entry><entry><title type="html">The Augmented Actuary: A System View on Actuarial Work</title><link href="https://augmentedactuary.com/2026/03/21/Augmented-Actuary.html" rel="alternate" type="text/html" title="The Augmented Actuary: A System View on Actuarial Work" /><published>2026-03-21T08:00:00+00:00</published><updated>2026-03-21T08:00:00+00:00</updated><id>https://augmentedactuary.com/2026/03/21/Augmented-Actuary</id><content type="html" xml:base="https://augmentedactuary.com/2026/03/21/Augmented-Actuary.html"><![CDATA[<h2 id="key-messages">Key Messages</h2>

<ul>
  <li><strong>The structure of actuarial work is stable.</strong> It already operates across reasoning, modeling, and workflows.</li>
  <li><strong>AI does not add a new layer.</strong> It augments each existing layer differently.</li>
  <li><strong>Reasoning becomes hybrid.</strong> Judgment is extended, challenged, and made explicit.</li>
  <li><strong>Modeling becomes computer-aided.</strong> Models become reusable and continuously applied.</li>
  <li><strong>Workflows become agent-organized.</strong> Execution is structured into systems that carry the work.</li>
  <li><strong>The shift is structural.</strong> From one-off analysis to persistent, reusable systems.</li>
  <li><strong>Accountability remains human.</strong> Augmentation strengthens governance rather than replacing it.</li>
</ul>

<hr />

<figure class="post-figure">
  <img src="/assets/img/The_Augmented_Actuary.png" alt="The Augmented Actuary framework showing three layers of actuarial work—Reasoning, Modeling, and Workflows—augmented respectively as Hybrid, Aided, and Agent-organized" loading="lazy" decoding="async" />
  <figcaption class="caption">
    A system view on actuarial work: the structure stays, but each layer is augmented differently.
  </figcaption>
</figure>

<p>Actuarial work hasn’t changed as much as we think. At its core, it has always operated across three layers:</p>
<ol>
  <li><strong>Reasoning</strong> — reasoning about uncertainty</li>
  <li><strong>Modeling</strong> — modeling it quantitatively</li>
  <li><strong>Workflows</strong> — embedding it into workflows</li>
</ol>

<p>What’s changing is not the structure, but how each layer is augmented.</p>
<ol>
  <li><strong>Reasoning becomes hybrid</strong><br />
→ thinking is extended, challenged, and made explicit</li>
  <li><strong>Modeling becomes computer-aided</strong><br />
→ models are not one-off, but continuously applied</li>
  <li><strong>Workflows become agent-organized</strong><br />
→ execution is structured into systems that carry the work</li>
</ol>

<p>Not autonomous. But no longer purely manual either.</p>

<p>What this creates is a shift: 
From work that is performed once to work that is captured, reused, and carried forward.
From thinking about doing to thinking about how it should be done.</p>

<hr />

<h2 id="where-this-becomes-practical">Where this becomes practical</h2>

<p>Across these areas, the question is no longer <em>whether</em> AI can be used —<br />
but <strong>how it is embedded into reasoning, modeling, and workflows in a controlled way</strong>.</p>

<p>This is the work I focus on:
making these layers explicit, connected, and operational — without losing accountability.</p>

<p>This is not theoretical — it shows up in very concrete places:</p>
<ul>
  <li><strong>Reserving / valuation</strong><br />
→ assumptions, adjustments, and reviews become explicit and repeatable<br />
→ less dependency on individual cycles</li>
  <li><strong>Pricing &amp; underwriting support</strong><br />
→ models become aware of state, trend, cycles, and experience<br />
→ decision logic becomes transparent, reusable and well-timed</li>
  <li><strong>Risk &amp; exposure management</strong><br />
→ scenario thinking becomes repeatable decision workflows<br />
→ capital stays stable while preserving risk awareness</li>
  <li><strong>Reporting &amp; governance</strong><br />
→ validation, accountability, and narratives are embedded<br />
→ visuals and messages compound each reporting cycle</li>
</ul>

<p>In all cases, the goal is the same:
<strong>not more models —<br />
but better structured work</strong></p>

<p>The way this is currently realized in practice is through integrating a structured agent framework into my agent factory, providing a consistent way to build, apply, and evolve systems that carry the work.</p>

<hr />

<h2 id="executive-takeaway">Executive takeaway</h2>

<p>The actuary does not need a new role — the structure of the work is already in place.</p>

<p>What changes is the operating model:</p>
<ul>
  <li>reasoning becomes hybrid</li>
  <li>modeling becomes computer-aided</li>
  <li>workflows become agent-organized</li>
</ul>

<p>The result is not faster work, but <strong>more durable work</strong>:</p>
<ul>
  <li>decisions improve because reasoning is clearer</li>
  <li>analytics scale because models are reusable</li>
  <li>execution stabilizes because workflows persist</li>
</ul>

<p>The opportunity is simple:<br />
<strong>turn actuarial work from something that is performed into something that continues to work.</strong></p>

<p>I’m happy to discuss how this can be implemented in practice — and where it already starts to create value.</p>

<hr />

<p>
Tags:

<a href="/tags/systems/">systems</a>, 

<a href="/tags/architecture/">architecture</a>, 

<a href="/tags/governance/">governance</a>, 

<a href="/tags/ai/">ai</a>, 

<a href="/tags/applied-ai-systems/">applied-ai-systems</a>

</p>]]></content><author><name>Bernhard von Boyen</name></author><category term="systems" /><category term="architecture" /><category term="governance" /><category term="ai" /><category term="applied-ai-systems" /><summary type="html"><![CDATA[Actuarial work already spans reasoning, modeling, and workflows. The shift is not a new profession, but a new operating model: hybrid reasoning, computer-aided modeling, and agent-organized workflows that make work persistent, scalable, and accountable.]]></summary></entry><entry><title type="html">Direction, Trust, and Stability: What a Small Stress Study Taught Me About Decision-Grade Models</title><link href="https://augmentedactuary.com/2026/02/11/Direction-Trust-Stability.html" rel="alternate" type="text/html" title="Direction, Trust, and Stability: What a Small Stress Study Taught Me About Decision-Grade Models" /><published>2026-02-11T07:00:00+00:00</published><updated>2026-02-11T07:00:00+00:00</updated><id>https://augmentedactuary.com/2026/02/11/Direction-Trust-Stability</id><content type="html" xml:base="https://augmentedactuary.com/2026/02/11/Direction-Trust-Stability.html"><![CDATA[<figure class="post-figure">
  <img src="/assets/img/Dam.png" alt="A modern alpine dam at dawn with calm water and subtle solar integration—an engineered boundary that holds under stress" loading="lazy" decoding="async" />
  <figcaption class="caption">
    A real-world metaphor: engineered capacity that holds under changing conditions.
  </figcaption>
</figure>

<h2 id="key-messages">Key Messages</h2>
<ul>
  <li><strong>Directional effects matter.</strong> They tell you <em>what influences what</em>—a real decision signal.</li>
  <li><strong>Trust is a separate layer.</strong> If assumptions fail, your conclusion can look precise while being unreliable.</li>
  <li><strong>Stability is information, not noise.</strong> Clustering tells you <em>how sensitive the system currently is</em>.</li>
  <li><strong>Business relevance is direct.</strong> Better trust and stability handling lead to safer and more profitable loss and capital decisions—especially in stressed regimes.</li>
</ul>

<hr />

<h2 id="why-i-reviewed-it">Why I reviewed it</h2>

<p>I recently helped review a small time-series study on stress and physiology. The purpose was practical and personal: to understand the relationship between a psychological state and a physical stress marker over time. My role was limited and clear. I wasn’t there to redesign the study or to add a new modeling framework. I simply wanted to help within my competence and make sure the conclusions were defensible.</p>

<p>The question sounded simple: <strong>does one variable influence the other over time?</strong></p>

<hr />

<h2 id="what-we-expected--and-what-actually-happened">What we expected — and what actually happened</h2>

<p>The initial hope was that the model would give a clean directional signal. Instead, the first pass produced contradictions:</p>

<ul>
  <li>In one setup, the direction looked plausible—but the model assumptions behind the test were not met.</li>
  <li>In another setup, the direction disappeared—even though the coefficients looked “confident” in isolation.</li>
  <li>In a third setup, the direction flipped depending on what was included or left out.</li>
</ul>

<p>This wasn’t a story of “the model is wrong.” It was a story of <strong>information loss and trust</strong>: the same data can appear to support direction, or not, depending on whether the system dynamics are represented and whether the test assumptions hold.</p>

<p>At that point, the main question changed from <em>“Is there an effect?”</em> to <em>“Can we trust what the model is claiming?”</em></p>

<hr />

<h2 id="the-hidden-issue-the-system-was-not-equally-stable-over-time">The hidden issue: the system was not equally stable over time</h2>

<p>A simple diagnostic made the situation clearer. When we looked at the size of the errors over time, they did not look random and evenly spread. They came in clusters: calm phases with small swings, stressed phases with large swings, then calm again.</p>

<p>In other words, the system didn’t just have a level. It had a <strong>stress state</strong> that made it more or less sensitive. That is intuitive in human systems: when someone is calm, small triggers lead to small reactions; when someone is stressed, the same triggers lead to larger reactions. The stability of the system itself has memory, and the sensitivity state persists.</p>

<p>Many classical tests implicitly assume this is not happening. If that assumption is violated, the result can look crisp while the confidence is misleading.</p>

<hr />

<h2 id="a-broader-anchor-herding-under-stressand-the-transfer-to-financial-lines">A broader anchor: herding under stress—and the transfer to financial lines</h2>

<p>This state-dependent sensitivity is not unique to physiology. Behavioral finance has long described <strong>herding</strong>: under stress, people react more strongly and start to follow each other’s behavior. Decisions become more synchronized, and volatility comes in waves.</p>

<p>Financial lines insurance has a close analogue. In calm periods, claims behavior can look stable. In stressed environments—economic downturns, litigation waves, or market shocks—defaults, lawsuits, and settlements can rise together. Reactions become aligned across many policies at once. Losses start to cluster.</p>

<p>So the volatility pattern in the study is not a technical nuisance. It is a signal of the system’s current sensitivity, and it has direct relevance for how we interpret directional results.</p>

<hr />

<h2 id="what-we-changed-and-what-we-did-not">What we changed (and what we did not)</h2>

<p>We did not redesign the model. Modeling a stress state explicitly would have gone beyond the task. But we did make one key move: we relaxed the “equally stable all the time” assumption and used a more robust, data-driven testing approach.</p>

<p>The directional story did not magically become significant. That wasn’t the goal. The goal was to <strong>make the inference valid, whichever way the result falls</strong>. A significant result from an invalid test or ignored signal is not evidence—it is bias disguised as confidence.</p>

<hr />

<h2 id="the-three-layers-of-value">The three layers of value</h2>

<figure class="post-figure">
  <img src="/assets/img/DecisionModels.png" alt="Decision-grade models under stress: direction, trust, and stability leading to safer and more profitable decisions" loading="lazy" decoding="async" />
  <figcaption class="caption">
    Decision-grade insight comes in layers: direction, trust, and stability.
  </figcaption>
</figure>

<p>In the end, the review produced three distinct layers of value.</p>

<h3 id="1-direction">1) Direction</h3>
<p>The model provides a directional signal: <strong>what influences what</strong> over time. That is real value and often the starting point for decisions.</p>

<h3 id="2-trust">2) Trust</h3>
<p>Assumption checking is not a formality. It is governance. It tells you whether the directional result is <strong>decision-grade</strong>, or merely “nice to look at.”</p>

<h3 id="3-stability-future-improvement">3) Stability (future improvement)</h3>
<p>Volatility clustering hinted at something deeper: the system behaves differently in calm and stressed phases. If that state is modeled explicitly later, you gain better prediction in all states because you are no longer forcing one sensitivity level onto the entire history.</p>

<hr />

<h2 id="business-implications-why-this-matters-for-losses-and-capital">Business implications: why this matters for losses and capital</h2>

<p>This is not just an academic point. In insurance and risk management, we routinely ask directional questions: what drives losses, and what drives capital needs?</p>

<p>Direction is valuable—but <strong>direction without trust</strong> leads to over-confident actions. Direction without stability awareness often breaks precisely in stressed regimes, when decisions matter most.</p>

<p>The practical implication is simple:</p>
<ul>
  <li><strong>Safer decisions:</strong> you avoid building capital and risk actions on fragile results.</li>
  <li><strong>More profitable decisions:</strong> you stop paying for false precision and can deploy risk capacity where it is genuinely rewarded.</li>
</ul>

<p>Stability awareness doesn’t reduce ambition. It reduces avoidable error.</p>

<hr />

<h2 id="executive-takeaway">Executive takeaway</h2>

<p>Directional results are useful, but the decision value comes from the next two questions:</p>
<ul>
  <li><strong>Can we trust the result?</strong></li>
  <li><strong>How sensitive is the system right now?</strong></li>
</ul>

<p>When you add trust and stability awareness, you don’t just get a model that explains the past. You get one that remains defensible—and useful—when the system moves into a stressed state.</p>

<hr />

<p>
Tags:

<a href="/tags/risk/">risk</a>, 

<a href="/tags/insurance/">insurance</a>, 

<a href="/tags/exposure-management/">exposure-management</a>, 

<a href="/tags/capital-management/">capital-management</a>, 

<a href="/tags/governance/">governance</a>, 

<a href="/tags/analytics/">analytics</a>

</p>]]></content><author><name>Bernhard von Boyen</name></author><category term="risk" /><category term="insurance" /><category term="exposure-management" /><category term="capital-management" /><category term="governance" /><category term="analytics" /><summary type="html"><![CDATA[A small time-series review: why directional effects are valuable, why trust can break when assumptions fail, and how stability signals point to better predictions—and better insurance decisions—under stress.]]></summary></entry><entry><title type="html">Risk Capacity, Exposure, and Order: Why Insurance Portfolios Fail — or Hold — as Systems</title><link href="https://augmentedactuary.com/2026/01/15/Exposure-ALM.html" rel="alternate" type="text/html" title="Risk Capacity, Exposure, and Order: Why Insurance Portfolios Fail — or Hold — as Systems" /><published>2026-01-15T07:00:00+00:00</published><updated>2026-01-15T07:00:00+00:00</updated><id>https://augmentedactuary.com/2026/01/15/Exposure-ALM</id><content type="html" xml:base="https://augmentedactuary.com/2026/01/15/Exposure-ALM.html"><![CDATA[<h2 id="key-messages">Key Messages</h2>
<ul>
  <li><strong>Risk must be taken in the right order.</strong> Growth constraints come before allocation decisions.</li>
  <li><strong>Risk capacity is an economic boundary — softer than regulatory capital, but harder than portfolio preferences.</strong> It is defined by cash-flow funding, stress survivability, and avoidance of forced liquidation.</li>
  <li><strong>Exposure management creates value only within constraints.</strong> Allocation matters only after admissible growth paths are established.</li>
  <li><strong>Fragmentation destroys coherence.</strong> When balance-sheet steering and exposure decisions are disconnected, value erodes silently.</li>
</ul>

<hr />

<h2 id="why-portfolios-fail-in-practice">Why portfolios fail in practice</h2>

<p>Most insurance portfolios do not fail because too much risk was taken.</p>

<p>They fail because risk was taken in the <strong>wrong order</strong>.</p>

<p>Some portfolios look diversified, yet struggle when inflation accelerates or liquidity tightens.<br />
Others remain solvent for decades, but consume far more capital than their economics justify.</p>

<p>In almost every case, the underlying tension comes down to two questions that are too often blurred:</p>

<ul>
  <li><em>How much risk can this system really carry over time?</em></li>
  <li><em>And where should that risk be deployed so it creates value rather than fragility?</em></li>
</ul>

<p>These questions point to two different kinds of discipline.<br />
They are not substitutes. They are orthogonal.</p>

<hr />

<h2 id="how-much-risk-can-the-balance-sheet-really-carry">How much risk can the balance sheet really carry?</h2>

<p>Every insurance system has a limit — not just a regulatory one, but an economic one.</p>

<p>Cash flows must be funded.<br />
Assets must survive stress.<br />
Capital must absorb volatility without forcing the wrong decisions at the wrong time.</p>

<p>That problem shows up in balance-sheet steering, i.e. Asset &amp; Liability Management (ALM).</p>

<p>This is where thinking about <strong>risk capacity</strong> matters: whether asset cash flows can fund liability cash flows, whether financial market stress can be survived, and whether growth paths avoid ruin or forced liquidation. These constraints determine how aggressive the system can be, how much drawdown it can tolerate, and how close to the edge it can operate.</p>

<p>Risk capacity does not arise in isolation. It is the output of a coherent <strong><a href="/2025/12/08/alm-system.html">ALM system</a></strong> — one that integrates capital, liquidity, accounting, and funding into a single steering logic. Without this system, risk capacity becomes unstable, stale, or distorted, and exposure decisions lose their economic meaning. Only once the ALM engine defines admissible growth paths does exposure management become a value-creating discipline rather than a defensive one.</p>

<figure class="post-figure">
  <img src="/assets/img/risk_capacity_growth_paths.png" alt="Admissible growth paths constrained by cash flows, stress survivability, and liquidation avoidance" loading="lazy" decoding="async" />
  <figcaption class="caption">
    Risk capacity defines which growth paths are admissible before any allocation decision is made. (Illustrative)
  </figcaption>
</figure>

<hr />

<h2 id="where-risk-capacity-actually-creates-value">Where risk capacity actually creates value</h2>

<p>Once risk capacity is understood, a different tension appears — and it is no longer a balance-sheet problem.</p>

<p>It is a <strong>portfolio problem</strong>.</p>

<p>Given a fixed risk budget:</p>
<ul>
  <li>Which exposures deserve it?</li>
  <li>Which ones quietly dominate the loss distribution?</li>
  <li>Which ones add value because they diversify <em>and</em> pay for the risk they bring?</li>
</ul>

<p>This is where exposure management lives — best understood as <strong>portfolio thinking applied to capital-relevant risk</strong>, not abstract return optimization.</p>

<p>Individual risks are allowed to be ugly.<br />
Portfolios are not.</p>

<p>With risk capacity fixed, the question shifts from how much risk to take to where it should sit in the portfolio.</p>

<figure class="post-figure">
  <img src="/assets/img/EffizientesPortfolio(1).png" alt="Efficient frontier under tail-risk constraints" loading="lazy" decoding="async" />
  <figcaption class="caption">
    With total risk capacity fixed, value emerges from allocation — not from individual positions. (SoccerSim Insurance Lab, Bundesliga Matchday 17)
  </figcaption>
</figure>

<hr />

<h2 id="why-diversification-alone-is-not-enough">Why diversification alone is not enough</h2>

<p>If exposure decisions were only about reducing risk, the optimal portfolio would be trivial:</p>
<ul>
  <li>infinite diversification,</li>
  <li>minimal exposure,</li>
  <li>no economic relevance.</li>
</ul>

<p>Real exposure decisions do the opposite.</p>

<p>They concentrate risk <strong>where it is paid for</strong>, and avoid it where it is not.</p>

<p>That requires looking at:</p>
<ul>
  <li>marginal contribution to tail risk,</li>
  <li>interaction effects between exposures,</li>
  <li>value density per unit of scarce risk capacity.</li>
</ul>

<p>This is why exposure management is uncomfortably close to value management — not because it ignores risk, but because it refuses to ignore where <strong>risk actually shows up in the distribution</strong>.</p>

<figure class="post-figure">
  <img src="/assets/img/marginal_risk_contributions.png" alt="Marginal contribution to portfolio tail risk by exposure" loading="lazy" decoding="async" />
  <figcaption class="caption">
    Some exposures add value with limited tail impact; others dominate the loss distribution without improving diversification. (SoccerSim Insurance Lab, Bundesliga Matchday 17)
  </figcaption>
</figure>

<hr />

<h2 id="why-pc-and-life-learned-different-lessons">Why P&amp;C and Life learned different lessons</h2>

<p>Historically, insurance lines evolved under different dominant uncertainties.</p>

<p>Property &amp; Casualty insurance grew around:</p>
<ul>
  <li>short-term contracts,</li>
  <li>annual repricing,</li>
  <li>event-driven, heavy-tailed losses.</li>
</ul>

<p>Aggregation was the problem. Exposure discipline matured naturally.</p>

<p>Life insurance grew around:</p>
<ul>
  <li>long-term guarantees,</li>
  <li>locked-in economics,</li>
  <li>sensitivity to discounting and reinvestment.</li>
</ul>

<p>Time was the problem. Balance-sheet steering matured naturally.</p>

<p>This split was not cultural. It was structural.</p>

<hr />

<h2 id="what-breaks-when-one-axis-is-ignored">What breaks when one axis is ignored</h2>

<p>Trouble starts when one dimension is managed in isolation.</p>

<p>P&amp;C portfolios without strong balance-sheet discipline tend to discover:</p>
<ul>
  <li>pricing that silently assumes benign inflation,</li>
  <li>liquidity stress after loss years,</li>
  <li>capital erosion driven by timing rather than aggregation.</li>
</ul>

<p>Aggregation is controlled — but the trajectory is not.</p>

<p>Life portfolios without strong exposure discipline tend to suffer from:</p>
<ul>
  <li>concentrated guarantees,</li>
  <li>capital locked into low-value risk,</li>
  <li>limited ability to reshape legacy books.</li>
</ul>

<p>Time is controlled — but risk density remains opaque.</p>

<p>In practice, these failures rarely appear as dramatic breakdowns. They surface gradually — as pricing surprises, unexplained capital strain, or uncomfortable questions that never quite get resolved.</p>

<figure class="post-figure">
  <img src="/assets/img/two_axes_risk_time_aggregation.png" alt="Two axes of insurance risk: aggregation and time" loading="lazy" decoding="async" />
  <figcaption class="caption">
    Each discipline controls one axis of uncertainty. Failure occurs when the other is ignored.
  </figcaption>
</figure>

<hr />

<h2 id="organizational-lens">Organizational lens</h2>

<p>What makes these failures persistent is rarely a lack of models.<br />
More often, it is a lack of <strong>organizational coherence</strong>.</p>

<p>Exposure decisions, capital policy, pricing assumptions, and balance-sheet steering typically sit in different parts of the organization, each optimized locally and defended rationally. Aggregation is managed in one place, funding assumptions in another, and capital constraints somewhere else entirely.</p>

<p>The result is not reckless risk-taking, but <strong>structural incoherence</strong>: a portfolio that makes sense in pieces, yet fails to behave as a system when stress arrives. Each function is locally right — and the portfolio is globally wrong. In practice, insurance risk does not fail along a single dimension.</p>

<p>Across exposures, the question is how risks interact at a point in time.<br />
Across time, the question is how the balance sheet evolves under stress.</p>

<p>Neither can substitute for the other.</p>

<hr />

<h2 id="what-a-complete-risk-system-looks-like">What a complete risk system looks like</h2>

<blockquote>
  <p>Exposure discipline without balance-sheet thinking creates hidden fragility.<br />
Balance-sheet discipline without exposure thinking creates hidden capital inefficiency.</p>
</blockquote>

<hr />

<h2 id="the-only-takeaway-that-matters">The only takeaway that matters</h2>

<p>No individual risk needs to be safe.</p>

<p>But the <strong>portfolio must be survivable</strong>,<br />
and <strong>risk capacity must be spent where it earns its keep</strong>.</p>

<p>In practice, improving insurance risk performance is less about better models, and more about aligning risk capacity, exposure decisions, and governance into a single, coherent system.</p>

<hr />

<p>
Tags:

<a href="/tags/risk/">risk</a>, 

<a href="/tags/insurance/">insurance</a>, 

<a href="/tags/alm/">alm</a>, 

<a href="/tags/exposure-management/">exposure-management</a>, 

<a href="/tags/portfolio-thinking/">portfolio-thinking</a>, 

<a href="/tags/capital-management/">capital-management</a>

</p>]]></content><author><name>Bernhard von Boyen</name></author><category term="risk" /><category term="insurance" /><category term="alm" /><category term="exposure-management" /><category term="portfolio-thinking" /><category term="capital-management" /><summary type="html"><![CDATA[Why insurance portfolios fail not because of too much risk, but because risk is taken in the wrong order — how survivability, risk capacity, and exposure allocation must be sequenced.]]></summary></entry><entry><title type="html">Vibe Coding vs. Agentic Development</title><link href="https://augmentedactuary.com/2026/01/04/Agentic-development.html" rel="alternate" type="text/html" title="Vibe Coding vs. Agentic Development" /><published>2026-01-04T07:00:00+00:00</published><updated>2026-01-04T07:00:00+00:00</updated><id>https://augmentedactuary.com/2026/01/04/Agentic-development</id><content type="html" xml:base="https://augmentedactuary.com/2026/01/04/Agentic-development.html"><![CDATA[<h2 id="key-messages">Key Messages</h2>
<ul>
  <li><strong>Vibe coding optimizes for momentum.</strong> It’s powerful for exploration, learning, and prototyping.</li>
  <li><strong>Agentic development optimizes for continuity.</strong> It turns work into reusable, owned capability.</li>
  <li><strong>AI sticks when work compounds.</strong> If you expect reuse, correctness, or handover, design for structure — not just speed.</li>
</ul>

<p><em>This piece grew out of a quieter stretch over the holidays, while reviewing my objectives and noticing which kinds of AI-assisted work actually carried forward — and which quietly reset.</em></p>

<p>Over the last year, <em>vibe coding</em> has become a popular way to describe working with AI. You prompt, the model responds, the code flows — and momentum feels high. And to be clear: <strong>vibe coding works</strong>, especially early on.</p>

<p>But after running cloud tools and a fully integrated, agent-oriented setup side by side, one difference kept showing up: <strong>vibe coding creates motion, while agentic development creates continuity</strong>. This post is about recognizing when each mode helps — and when it quietly starts to fail.</p>

<hr />

<h2 id="what-i-mean-by-vibe-coding">What I mean by <em>vibe coding</em></h2>

<p>Vibe coding is characterized by fast feedback loops, a strong sense of flow, and generalist models that can do a bit of everything. Context is rebuilt each session, and progress is driven by conversation rather than structure.</p>

<p>It’s excellent for exploration, learning, sketching ideas, and <strong>scripting or prototyping</strong>. In that sense, vibe coding increasingly plays a role similar to what Excel once did for professionals: a flexible, low-friction environment for thinking, exploring, and shaping ideas.</p>

<p><strong>For many knowledge workers, it’s already starting to replace spreadsheets as the first place ideas take shape — essentially <em>Excel plus specification</em>: flexible, expressive, and closer to intent.</strong> Most positive first AI experiences live here, and that’s a good thing.</p>

<hr />

<h2 id="where-vibe-coding-breaks-down">Where vibe coding breaks down</h2>

<p>The limitations don’t appear immediately. They surface after repetition.</p>

<p>You notice yourself re-explaining the same architecture, dealing with subtle drift in assumptions, or getting outputs that are “almost right” but hard to trust. Manual steps start to pile up — steps that clearly <em>should</em> be automated.</p>

<p>The work moves, but it doesn’t <strong>accumulate</strong>.</p>

<hr />

<h2 id="a-quick-self-check">A quick self-check</h2>

<p>If any of these feel familiar, you’re already past pure vibe coding:</p>

<ul>
  <li>“I already explained this once.”</li>
  <li>“This breaks something subtle.”</li>
  <li>“I don’t quite trust this output.”</li>
  <li>“Future-me won’t understand this.”</li>
</ul>

<p>These aren’t tooling issues. They’re <strong>architecture signals</strong>.</p>

<hr />

<h2 id="what-i-mean-by-agentic-development">What I mean by <em>agentic development</em></h2>

<p>Agentic development is not about autonomous AI. It’s about <strong>designing work so it survives contact with time</strong>.</p>

<p>In a sense, this wasn’t a surprise. I’ve always been skeptical of productivity gains driven purely by tools — not because tools don’t help, but because their benefits tend to decay unless they’re embedded in systems. Working with AI simply made that pattern visible again, at much higher speed.</p>

<p>That belief has shaped how I work in practice. Over time, it led me away from loosely coupled setups — moving from Spyder and standalone ChatGPT sessions toward an integrated environment built around VS Code, Continue, and local models like Qwen. Not because those tools are inherently better, but because they allow context, structure, and intent to live alongside the work itself.</p>

<p>Crucially, that shift didn’t reduce flexibility — it increased it. When context and artifacts are explicit, changing models, workflows, or levels of automation becomes easier, not harder.</p>

<hr />

<h2 id="what-changes-in-practice">What changes in practice</h2>

<p>In practice, agentic development shows up as improved context that is explicit, stored, versioned, and reused. It brings more specificity through agents with clear roles and boundaries, and it encourages using the <strong>best model for the job</strong>, not simply the biggest one.</p>

<p>Performance and low latency start to matter because they change how you think. Ergonomics improve because the environment adapts to the workflow. Drift is minimized through schemas and constraints, architecture becomes more targeted, and outputs turn into <strong>actionable artifacts</strong>, not just answers. Most importantly, everything lives in a <strong>fully integrated environment</strong>, not scattered tools.</p>

<p>This isn’t about replacing the developer. It’s about <strong>compounding the developer’s work</strong>.</p>

<hr />

<h2 id="from-vibe-to-agentic-is-a-spectrum--not-a-switch">From vibe to agentic is a spectrum — not a switch</h2>

<figure class="post-figure">
  <img src="/assets/img/vibe_to_agentic_spectrum.png" alt="Spectrum from vibe coding to agentic work" loading="lazy" decoding="async" />
  <figcaption class="caption">
    Vibe coding and agentic work sit on a spectrum — reuse is the shift point.
  </figcaption>
</figure>

<p>I find it useful to think of this as a gradual shift rather than a binary choice. Context moves from ephemeral to explicit, models from generalist to task-specific, drift from tolerated to constrained, and outputs from conversational to artifact-driven. The time horizon stretches from hours to months.</p>

<p>You don’t “graduate” from vibe coding. You move along the spectrum when reuse starts to matter.</p>

<hr />

<h2 id="a-note-on-ownership-and-ip">A note on ownership and IP</h2>

<p>There’s also an ownership aspect to this. When work happens primarily in chat sessions, the boundaries around context, reuse, and intellectual property are blurry by default. In an agentic setup, the opposite is true: prompts, logic, schemas, and outputs live as explicit artifacts alongside the code.</p>

<p>That makes ownership, reuse, and transition clearer — not as a legal statement, but as a practical one. The value isn’t in the model response; it’s in the structure that shapes it.</p>

<hr />

<h2 id="a-simple-mental-model-for-compounding-work">A simple mental model for compounding work</h2>

<figure class="post-figure">
  <img src="/assets/img/compounding_layers.png" alt="Foundation, execution, and compounding layers" loading="lazy" decoding="async" />
  <figcaption class="caption">
    AI sticks when the compounding layer is designed deliberately.
  </figcaption>
</figure>

<p>I find it helpful to think in three layers:</p>

<ol>
  <li><strong>Foundation</strong> — LLM-integrated workstations that are reproducible, versioned, and deployable.</li>
  <li><strong>Execution</strong> — helpers and workers optimized for speed and ergonomics.</li>
  <li><strong>Compounding</strong> — artifacts, schemas, memory, and reuse that turn work into capability.</li>
</ol>

<p>Most AI setups focus on the middle layer. <strong>AI only sticks when the top layer is designed deliberately.</strong></p>

<hr />

<h2 id="when-to-use-which">When to use which</h2>

<figure class="post-figure">
  <img src="/assets/img/decision_flow_vibe_vs_agentic.png" alt="Decision flow for moving from vibe coding to agentic development" loading="lazy" decoding="async" />
  <figcaption class="caption">
    A simple trigger: move to structure when reuse starts to matter.
  </figcaption>
</figure>

<p>Use vibe coding when you’re exploring a new idea, when speed matters more than correctness, and when the output is meant to stay lightweight.</p>

<p>Switch to agentic development when you’ve rewritten the same prompt twice, when correctness matters downstream, when outputs feed other systems or decisions, or when you’re delegating to future-you.</p>

<p><strong>If you expect reuse, design for compounding.</strong></p>

<hr />

<h2 id="the-takeaway">The takeaway</h2>

<p>Vibe coding optimizes for momentum. Agentic development optimizes for continuity. One feels fast; the other <strong>stays fast</strong>.</p>

<p>The most effective setups use both: vibe coding for exploration, and agentic development for everything that should last. If work doesn’t compound, AI productivity resets every quarter. If it does, AI finally starts to stick.</p>

<p><em>Seen this way, the shift toward agentic development wasn’t a conversion, but a reinforcement. The hypothesis stayed the same — systems compound, tools decay — AI just made the feedback loop fast enough to act on.</em></p>

<hr />

<p>
Tags:

<a href="/tags/agents/">agents</a>, 

<a href="/tags/agentic-pipelines/">agentic-pipelines</a>, 

<a href="/tags/systems/">systems</a>, 

<a href="/tags/productivity/">productivity</a>

</p>]]></content><author><name>Bernhard von Boyen</name></author><category term="agents" /><category term="agentic-pipelines" /><category term="systems" /><category term="productivity" /><summary type="html"><![CDATA[Why feeling productive is not the same as building systems that compound — and when AI work actually starts to stick.]]></summary></entry><entry><title type="html">Why I Only Talk About Agents That Run in Public</title><link href="https://augmentedactuary.com/2025/12/21/Talk-agent.html" rel="alternate" type="text/html" title="Why I Only Talk About Agents That Run in Public" /><published>2025-12-21T07:00:00+00:00</published><updated>2025-12-21T07:00:00+00:00</updated><id>https://augmentedactuary.com/2025/12/21/Talk-agent</id><content type="html" xml:base="https://augmentedactuary.com/2025/12/21/Talk-agent.html"><![CDATA[<h2 id="key-messages">Key Messages</h2>
<ul>
  <li><strong>Agents must be real, not demo artifacts.</strong> If they only work in private, they are hard to trust.</li>
  <li><strong>Public operation creates accountability.</strong> Visibility forces clear boundaries and honest failure.</li>
  <li><strong>Restraint matters more than capability.</strong> What an agent does <em>not</em> do defines its quality.</li>
  <li><strong>The homepage agent is an interface, not the system.</strong> It makes the architecture visible, not complete.</li>
  <li><strong>The next step is infrastructure, not intelligence.</strong> Action, privacy, and independence come before learning.</li>
</ul>

<hr />

<p>I hesitated to talk about AI agents. Not because they aren’t powerful, but because too many of them only exist in private prompts, demos, or slide decks. They sound impressive, but you never really see them operate under real conditions — with real users, real ambiguity, and real consequences.</p>

<p>So I made a rule for myself.</p>

<p><img src="/assets/img/Talk_agent.png" alt="Rule: If I talk about an agent, it must run in public" /></p>

<p>If I talk about an agent, it must be real. It must run in public. It must be allowed to fail in public. And it must help me at least as much as it helps others.</p>

<p>“Public” here doesn’t mean public infrastructure. It means public accountability: the agent’s behavior, boundaries, and failures are visible and testable, even if the system itself runs privately. Private agents can still support public interfaces — in fact, they often must. Agents are expected to work quietly and reliably in the background; accountability is about what can be observed, not where the code runs.</p>

<p>That rule isn’t about transparency for its own sake. It’s about credibility. If something only works in private, it’s hard to trust. If it never fails visibly, it’s impossible to learn from. And if it’s built only for others, it tends to drift away from reality very quickly.</p>

<p>When people talk about AI agents, a familiar set of expectations usually comes up: autonomy, context awareness, memory, tool use, the ability to act rather than just respond. Those expectations aren’t wrong. But they’re often discussed abstractly, without saying where they actually show up in a working system — and where they don’t.</p>

<p>Putting an agent on my homepage forced me to answer that question honestly.</p>

<p>In some important ways, the homepage agent clearly behaves like an agent. It has a concrete goal: helping visitors orient themselves in my work and decide what is relevant to them. It reasons over context instead of dumping information, and it makes decisions I don’t micro-prompt — how deep to go, when to summarize, and when to redirect back to me. When a question calls for depth, it hands off the drill-down on topics or posts to a dedicated worker instead of trying to do everything itself. That’s not just conversational polish; it’s goal-directed behavior within a defined scope.</p>

<p>Just as important are the ways it is deliberately constrained. The agent doesn’t invent authority or promise outcomes. It doesn’t compress complex topics into slogans just to be helpful, and it doesn’t “learn” invisibly in the background. Its memory is bounded by design. When it improves, it’s because I change the source — my writing, my structure, my thinking — not because something opaque adjusted itself overnight.</p>

<p>The most obvious gap becomes visible precisely because the agent runs in public: action. Today, it can reason and route, but it can’t yet take decisive steps beyond conversation. No scheduling, no coordination, no external effects. That gap isn’t accidental. It’s a boundary I want to cross explicitly, not by accident.</p>

<p>Making the agent public makes these boundaries impossible to ignore — and that’s exactly the point.</p>

<p>The next step isn’t “more intelligence”, and it isn’t primarily about improving the homepage agent itself. That agent already serves its purpose: it makes the system visible.</p>

<p>What comes next is about the underlying setup. In January, I want to formalize a personal agent and worker framework that runs at home, on my own infrastructure. The focus there is on structure rather than features: enabling decisive, auditable actions via MCPs; keeping sensitive context local for privacy and trust; and designing the system to be independent of any single model or vendor, so it can scale without lock-in. The homepage agent will simply remain one public interface to that system — not its center of gravity.</p>

<p>What I’m deliberately not adding yet is persistent state or autonomous learning. Those are powerful capabilities, and exactly the kind that deserve their own design phase, governance, and scrutiny. I see them as headroom, not omission.</p>

<p>The point isn’t that this agent is advanced. It’s that it’s visible, constrained, and accountable — including to me. That’s why I’m comfortable talking about it in public.</p>

<hr />

<p>
Tags:

<a href="/tags/agents/">agents</a>, 

<a href="/tags/governance/">governance</a>, 

<a href="/tags/strategy/">strategy</a>, 

<a href="/tags/precision-ai/">precision-ai</a>

</p>]]></content><author><name>Bernhard von Boyen</name></author><category term="agents" /><category term="governance" /><category term="strategy" /><category term="precision-ai" /><summary type="html"><![CDATA[A personal standard for building AI agents — visibility, restraint, and accountability over demos and hype.]]></summary></entry><entry><title type="html">Building a Palantir-Level Operating System With Open Source</title><link href="https://augmentedactuary.com/2025/12/08/OS-stack.html" rel="alternate" type="text/html" title="Building a Palantir-Level Operating System With Open Source" /><published>2025-12-08T07:00:00+00:00</published><updated>2025-12-08T07:00:00+00:00</updated><id>https://augmentedactuary.com/2025/12/08/OS-stack</id><content type="html" xml:base="https://augmentedactuary.com/2025/12/08/OS-stack.html"><![CDATA[<h2 id="key-messages">Key Messages</h2>
<ul>
  <li><strong>Enterprise intelligence is no longer exclusive.</strong> Open-source and LLMs have collapsed the cost and capability gap once dominated by Palantir.</li>
  <li><strong>Licensing and economics shape strategy.</strong> Open ecosystems provide sovereignty and adaptability; proprietary ones restrict it.</li>
  <li><strong>Low-code tools promise simplicity but limit depth.</strong> Python + LLM + pipelines deliver real capability with low complexity.</li>
  <li><strong>Skills are broadly attainable.</strong> Python, SQL, orchestration, lineage and LLMs now form a realistic stack for small teams.</li>
  <li><strong>Small businesses can now build their own operating system.</strong> What once required enterprise budgets is now achievable on a single workstation.</li>
</ul>

<hr />

<p>For years, Palantir set the benchmark for connected data, modelling, and operational intelligence. I’ve worked with teams that used Palantir-style platforms, and I’ve built modern Python/LLM systems in insurance, finance, sports analytics and medical documentation. From this dual experience one conclusion is clear: <strong>what once required Palantir can now be built with open-source tools at a fraction of the cost — with far more strategic control.</strong> This shift is driven by open licensing, drastically lower compute costs, and the capability unlocked by LLMs, while low-code platforms still fail to deliver the depth and flexibility they promise.</p>

<h2 id="1-licenses--costs-the-strategic-break">1. Licenses &amp; Costs: The Strategic Break</h2>
<p>The difference between enterprise platforms and open source is primarily about <strong>ownership and economics</strong>, not features. Open-source components (MIT/Apache) provide:</p>
<ul>
  <li><strong>sovereignty and no lock-in</strong>,</li>
  <li><strong>no proprietary friction around data or models</strong>,</li>
  <li><strong>full control over logic</strong>, crucial for ALM, risk, medical or analytics IP.</li>
</ul>

<p>Cost amplifies the shift. Enterprise platforms operate at <strong>CHF2,000–CHF8,000 per user/month</strong>, whereas a modern Python/LLM intelligence layer typically costs <strong>CHF30–CHF150 per user/month</strong>. The impact is not just savings — it expands option space: more users, more experimentation, and budget shifted back to modelling instead of licensing. <strong>Cost + LLMs have lowered the barrier dramatically.</strong></p>

<h2 id="2-skills-why-the-discipline-is-now-replicable">2. Skills: Why the Discipline Is Now Replicable</h2>
<p>Palantir’s real value is the discipline of connecting data → models → decisions → operations. Today, that discipline is replicable with accessible skills:</p>
<ul>
  <li><strong>Python</strong> for modelling and automation</li>
  <li><strong>SQL</strong> for business logic</li>
  <li><strong>LLMs</strong> for extraction, summarisation and agent workflows</li>
  <li><strong>Airflow/Prefect</strong> for reliable pipelines</li>
  <li><strong>Lineage tools</strong> for auditability</li>
  <li><strong>Postgres + DuckDB</strong> as a compact analytical backbone</li>
  <li><strong>FastAPI</strong> for operational services</li>
  <li><strong>Superset/Metabase</strong> for dashboards</li>
  <li><strong>GitHub/GitLab</strong> for CI/CD</li>
</ul>

<p>These are standard modern data tools, not specialised vendor-only skills. <strong>The barrier to enterprise-grade capability has collapsed.</strong></p>

<h2 id="3-strategy-building-your-own-operating-system">3. Strategy: Building Your Own Operating System</h2>
<p>Having worked with both proprietary and open architectures, the strategic distinction is sharp. Palantir offers:</p>
<ul>
  <li>fast integration,</li>
  <li>embedded teams,</li>
  <li>governed workflows,</li>
  <li>and a strong opinionated operating model.</li>
</ul>

<p>Open source offers something different:</p>
<ul>
  <li><strong>differentiation</strong> — your models reflect your worldview,</li>
  <li><strong>replaceability</strong> — every layer can evolve independently,</li>
  <li><strong>sovereignty</strong> — essential for regulated or sensitive environments,</li>
  <li><strong>compounding internal expertise</strong>, not outsourced dependency.</li>
</ul>

<p>For ALM, reinsurance, pensions, healthcare, or sports analytics this is decisive: <strong>your modelling IP is your competitive edge — you cannot outsource your edge.</strong></p>

<h2 id="4-entry-level-why-even-a-small-team-can-do-this">4. Entry Level: Why Even a Small Team Can Do This</h2>
<p>The most dramatic change is how accessible these systems have become. LLMs and open-source tooling have removed the entry barrier entirely. A single engineer can build a functional intelligence layer using:</p>
<ul>
  <li><strong>Python + SQL</strong>,</li>
  <li><strong>Postgres + DuckDB</strong>,</li>
  <li><strong>Airflow or Prefect</strong>,</li>
  <li><strong>Pandas/dbt</strong>,</li>
  <li><strong>FastAPI</strong>,</li>
  <li><strong>Superset</strong>,</li>
  <li><strong>GitHub</strong>,</li>
  <li><strong>local or cloud LLMs</strong> (Mistral, LLaMA).</li>
</ul>

<p>With this, any business can automate:</p>
<ul>
  <li>reporting, documentation and reconciliation,</li>
  <li>ALM, capital or pricing projections,</li>
  <li>underwriting workflows,</li>
  <li>portfolio and customer analytics,</li>
  <li>sports simulations,</li>
  <li>medical case processing.</li>
</ul>

<p>I’ve built on setups as small as a single workstation with a mid-range CPU/GPU (and can be leased or owned). <strong>This is not big-tech territory — it is hands on data science within reach of small teams.</strong> Also, in stanard software you pay for all layers immediately, despite in practice, you can only build one layer at a time. This usually starts with pipelines and data sourcing.</p>

<h2 id="conclusion-own-your-operating-system">Conclusion: Own Your Operating System</h2>
<p>Palantir remains powerful, but the landscape has changed. If you understand data and modelling, you can now build a <strong>sovereign, flexible, automated intelligence layer</strong> that reflects your business rather than a vendor’s template. With cost no longer a barrier, the strategic question becomes simple: <strong>do you want to own your operating system — or rent it?</strong></p>

<hr />

<p>Tags:  <a href="/tags/systems/">systems</a>,   <a href="/tags/architecture/">architecture</a>,   <a href="/tags/open-source/">open-source</a>,   <a href="/tags/engineering/">engineering</a>  </p>]]></content><author><name>Bernhard von Boyen</name></author><category term="systems" /><category term="architecture" /><category term="open-source" /><category term="engineering" /><summary type="html"><![CDATA[How modern Python/LLM ecosystems now rival enterprise platforms — from someone who has worked deeply in both worlds.]]></summary></entry><entry><title type="html">ALM as a System: How Modern Insurers Create (or Destroy) Value</title><link href="https://augmentedactuary.com/2025/12/08/alm-system.html" rel="alternate" type="text/html" title="ALM as a System: How Modern Insurers Create (or Destroy) Value" /><published>2025-12-08T07:00:00+00:00</published><updated>2025-12-08T07:00:00+00:00</updated><id>https://augmentedactuary.com/2025/12/08/alm-system</id><content type="html" xml:base="https://augmentedactuary.com/2025/12/08/alm-system.html"><![CDATA[<h2 id="key-messages">Key Messages</h2>
<ul>
  <li><strong>Outcomes differ because systems differ.</strong> Success in ALM is not about expert teams, but about whether the organisation operates as an integrated system.</li>
  <li><strong>Fragmentation destroys value silently.</strong> Misaligned risk, treasury, capital, pricing, accounting and investment functions create hidden frictional costs and deteriorating capacity.</li>
  <li><strong>ALM is a strategic engine, not a reporting function.</strong> When designed intentionally, it coordinates constraints, economics, liquidity and solvency into one steering logic.</li>
  <li><strong>Integrated ALM creates capacity, discipline and clarity.</strong> It enables better pricing, more stable earnings, improved growth decisions and transparent risk–return profiles.</li>
  <li><strong>A modern ALM system must be timely, connected and economically grounded.</strong> This article outlines how such a system is structured and why it matters.</li>
</ul>

<hr />

<p>In my career, I have seen what it takes for deals to succeed, for risks to be absorbed cleanly, for losses to be avoided, for appetite to stay aligned, for growth to build on discipline, for limits to guide decisions, for treasury and capital management to create value, for the investment function to contribute real economic return, for pricing to remain tight, for models to illuminate reality, for capital to be well allocated, for accounting to support true economics, for processes to be timely, and for frameworks to be holistic.<br />
<strong>These outcomes are not coincidences. They arise from systems that are designed, connected, and governed for complexity.</strong>
But across the industry, these systems rarely exist in full. Insurers often rely on fragmented processes and misaligned functions: treasury acting without visibility into liquidity pathways, capital management operating on stale assumptions, investments pursuing return without ALM integration, pricing working with incomplete constraints, and accounting frameworks that distort rather than clarify economic value.</p>

<p>When this happens, insurers experience recurring patterns:</p>
<ul>
  <li>appetite evaporates without clear cause</li>
  <li>frictional costs accumulate unnoticed</li>
  <li>limits become symbolic rather than binding</li>
  <li>pricing becomes too generous under pressure</li>
  <li>growth stalls despite market opportunity</li>
  <li>profitability erodes long before it appears in P&amp;L</li>
</ul>

<p>None of this is due to weak teams — the expertise exists everywhere.<br />
<strong>The issue is that the system does not reflect the actual risks, frictions, constraints, and interdependencies of modern balance sheets.</strong></p>

<p>This is the heart of ALM.</p>

<p>ALM is not a reporting function. It is the <strong>strategic engine</strong> that integrates:</p>
<ul>
  <li>capital</li>
  <li>liquidity</li>
  <li>investment</li>
  <li>treasury</li>
  <li>accounting</li>
  <li>pricing</li>
  <li>market risk</li>
</ul>

<p>When ALM works, it unlocks capacity, enforces discipline, strengthens pricing, reveals frictional costs, and turns complexity into navigable structure. When it fails, value is destroyed silently — in treasury flows, spread realism, liquidity constraints, reinvestment assumptions, and accounting artefacts.
A modern ALM function must therefore be <strong>intentional, timely, integrated, explainable, and economically grounded</strong>.</p>

<p>That is the journey this article explores: <strong>how insurers can build systems that deliver the outcomes we know are possible — and avoid the failures we have all seen.</strong></p>

<hr />

<h2 id="the-alm-system--overview">The ALM System — Overview</h2>
<p>ALM must be understood as a <strong>connected system</strong>, not a department.<br />
The diagram below illustrates this structure in a mobile-friendly format.</p>

<p><img src="/assets/img/ALM_System_small.png" alt="ALM as a System" class="img-responsive" /></p>

<p><strong>Figure:</strong> <em>Strategy → ALM Core Engine → Functional Engines → Translators → Outcomes, with feedback loops that refine appetite and constraints.</em></p>

<p>To clarify the layers shown in the simplified diagram:</p>
<ul>
  <li><strong>Strategic layer:</strong> appetite and constraints</li>
  <li><strong>Core engine:</strong> integrated economic, liquidity, capital and accounting views</li>
  <li><strong>Functional pillars:</strong> investments, treasury, capital management</li>
  <li><strong>Translators:</strong> pricing &amp; accounting as constraint enforcers</li>
  <li><strong>Outcomes:</strong> steering, capacity, growth, stability</li>
  <li><strong>Feedback loop:</strong> outcomes refine appetite dynamically</li>
</ul>

<hr />

<h2 id="why-systems-win-where-processes-fail">Why Systems Win Where Processes Fail</h2>
<p>Most insurers do not suffer from lack of intelligence or expertise. They suffer from <strong>disconnected systems</strong>:</p>
<ul>
  <li>Treasury decisions that ignore investment flows</li>
  <li>Capital assumptions that lag economic reality</li>
  <li>Pricing frameworks unaware of liquidity constraints</li>
  <li>Investments managed without solvency context</li>
  <li>Accounting volatility shaping decisions more than economics</li>
</ul>

<p>The ALM system binds these parts into a coherent whole — and coherence is what produces high-quality outcomes.</p>

<hr />

<h2 id="what-a-modern-alm-engine-must-deliver">What a Modern ALM Engine Must Deliver</h2>
<p>A functioning ALM system provides:</p>
<ul>
  <li><strong>Timeliness</strong> — decisions based on updated economic, liquidity and solvency conditions</li>
  <li><strong>Integration</strong> — one coordinated model of risk, capital, liquidity and accounting</li>
  <li><strong>Explainability</strong> — narratives that reconcile numbers with decisions</li>
  <li><strong>Economic grounding</strong> — true value creation over accounting artefacts</li>
  <li><strong>Strategic feedback</strong> — outcomes that refine appetite dynamically</li>
</ul>

<p>ALM becomes <strong>active steering</strong>, not backward reporting.</p>

<hr />

<h2 id="the-value-case-for-integrated-alm">The Value Case for Integrated ALM</h2>
<p>With a modern ALM system, insurers gain:</p>
<ul>
  <li>visibility of frictional costs</li>
  <li>discipline in pricing</li>
  <li>capital efficiency</li>
  <li>liquidity resilience</li>
  <li>clearer growth decisions</li>
  <li>reduced operational surprises</li>
  <li>transparency in risk and return</li>
</ul>

<p>Without it, value disappears silently for years through cumulative structural leakage.</p>

<hr />

<h2 id="conclusion">Conclusion</h2>
<p>ALM is not about producing reports. It is about building systems that create <strong>clarity</strong>, <strong>capacity</strong>, and <strong>long-term value</strong>.
Insurers who recognise this shift — and who design ALM as an integrated, feedback-driven engine — position themselves for sustainable profitability and disciplined growth.</p>

<hr />

<p>Tags:  <a href="/tags/alm/">ALM</a>,   <a href="/tags/insurance/">insurance</a>,   <a href="/tags/capital-management/">capital-management</a>,   <a href="/tags/strategy/">strategy</a>  </p>]]></content><author><name>Bernhard von Boyen</name></author><category term="ALM" /><category term="insurance" /><category term="capital-management" /><category term="strategy" /><summary type="html"><![CDATA[A system-level perspective on ALM: why outcomes differ, where value leaks, and how an integrated ALM engine unlocks clarity, capacity and sustainable growth.]]></summary></entry><entry><title type="html">How a Sporting Director Uses Predictive Intelligence</title><link href="https://augmentedactuary.com/2025/12/04/management-clarity.html" rel="alternate" type="text/html" title="How a Sporting Director Uses Predictive Intelligence" /><published>2025-12-04T07:00:00+00:00</published><updated>2025-12-04T07:00:00+00:00</updated><id>https://augmentedactuary.com/2025/12/04/management-clarity</id><content type="html" xml:base="https://augmentedactuary.com/2025/12/04/management-clarity.html"><![CDATA[<p>As a sporting director, I’m not looking for more statistics. I’m looking for clarity.<br />
Predictive intelligence helps me understand where we truly stand, how our season is shifting, and what decisions are becoming unavoidable.</p>

<hr />

<h2 id="key-messages">Key messages</h2>
<ul>
  <li><strong>Expected league position</strong> filters out noise and reveals our real competitive level.</li>
  <li><strong>Probability trajectories</strong> show whether the season is stabilising or drifting.</li>
  <li><strong>Squad dashboards</strong> explain <em>why</em> results happen and where structural weaknesses lie.</li>
  <li><strong>Predictive modelling</strong> improves communication, planning and decision-making across the club.</li>
  <li>xGs are silver, <strong>xPs are gold</strong>.</li>
</ul>

<hr />

<h2 id="1-expected-position--a-clearer-league-table">1. Expected position — a clearer league table</h2>
<p>I use the expected end-of-season position as the first anchor for discussions with coaches, the board, and scouts.</p>

<p><img src="/assets/img/Liga_ErwartetePositionEndtabelle.png" alt="Expected League Position" /></p>

<p>Here, Leipzig stabilises upward while Wolfsburg drifts downward; a reminder that results and underlying performance often diverge. This informs tone, expectations and the urgency of interventions.</p>

<hr />

<h2 id="2-probability-trajectories--how-the-season-is-really-unfolding">2. Probability trajectories — how the season is really unfolding</h2>
<p>Trend lines matter more than snapshots.</p>

<p><img src="/assets/img/VfLWolfsburg_EntwicklungWahrscheinlichkeiten.png" alt="Wolfsburg Probabilities" /></p>

<p>Wolfsburg’s falling UCL probability and rising relegation risk tell a simple story: the early view and current performance of the squad is diverging, and course-correction becomes a strategic necessity.</p>

<p>I rely on these curves to judge whether we stay on plan or need to adjust.</p>

<hr />

<h2 id="3-deep-squad-view--understanding-why-results-happen">3. Deep squad view — understanding <em>why</em> results happen</h2>
<p>This VfB dashboard illustrates how structural insight replaces guesswork.</p>

<p><img src="/assets/img/vfb_dashboard_brandstyle_v3.png" alt="VfB Dashboard" /></p>

<p>Key signals I look for:</p>

<ul>
  <li>Expected score vs market assessment - my look in the mirror to truly understand external perception</li>
  <li>Squad strengths and weaknesses (attack, defence, home/away profile)  - who am I, how strong is my competitor</li>
  <li>Scenario probabilities (Top 6, relegation, mid-table) - am I still on track, to separate the heat of the moment from my management objectives</li>
  <li>Expected-points outlook for the next fixtures - how do I navigate the immediate future</li>
  <li>Final table - move away from 6-points-game now, to truly understand who am I competing with currently</li>
</ul>

<p>These views align conversations with coaching staff and support decisions on rotation, recruitment and development. The coach can adapt and simulate strategies (squad choice and tactical formation).</p>

<hr />

<h2 id="4-what-predictive-intelligence-enables">4. What predictive intelligence enables</h2>
<p>In daily practice, it gives me:</p>

<ul>
  <li>A neutral, model-based view of squad quality</li>
  <li>Early detection of performance drift</li>
  <li>Better planning for finance, budgeting, contracts, transfers and coaching</li>
  <li>More credible communication with board, owners and supporters</li>
</ul>

<p>Predictive intelligence doesn’t remove uncertainty — it gives it structure.</p>

<hr />

<h2 id="conclusion">Conclusion</h2>
<p>Football is chaotic in the short run but structural in the long run. As a sporting director, I use predictive models to understand those structures, anticipate inflection points and make decisions before problems become visible in the table.</p>

<p>The truth is on the pitch — but the future becomes visible in the model.</p>

<hr />

<p>Tags:  <a href="/tags/sports/">sports</a>,   <a href="/tags/analytics/">analytics</a>,   <a href="/tags/leadership/">leadership</a>  </p>]]></content><author><name>Bernhard von Boyen</name></author><category term="sports" /><category term="analytics" /><category term="leadership" /><summary type="html"><![CDATA[A concise, first-person view on how predictive models clarify squad strength, trajectories and scenario risks.]]></summary></entry><entry><title type="html">A Structured, Quantitative Approach to Sports Betting: Value, Portfolios and Risk</title><link href="https://augmentedactuary.com/2025/12/04/value-bets.html" rel="alternate" type="text/html" title="A Structured, Quantitative Approach to Sports Betting: Value, Portfolios and Risk" /><published>2025-12-04T07:00:00+00:00</published><updated>2025-12-04T07:00:00+00:00</updated><id>https://augmentedactuary.com/2025/12/04/value-bets</id><content type="html" xml:base="https://augmentedactuary.com/2025/12/04/value-bets.html"><![CDATA[<p>Quantitative betting differs fundamentally from intuition-driven tipping.<br />
It follows a structured workflow: <strong>identify value</strong>, <strong>construct portfolios</strong>, <strong>assess risk</strong>.<br />
This post illustrates how a data-driven bettor approaches Matchday 12 — calm, systematic, evidence-based.</p>

<hr />

<h2 id="key-messages">Key messages</h2>
<p>Portfolios win — not individual bets.<br />
The visualisations below highlight the core insights:</p>

<ul>
  <li>Value is the starting point, not the decision.</li>
  <li>Equal Weight is inefficient; Max Return is overly concentrated.</li>
  <li>Optimised portfolios provide the best balance of return, risk and stability.</li>
  <li>Risk profiles and loss contributions become meaningful only when visualised.</li>
</ul>

<p>Key metrics from Matchday 12:</p>

<table>
  <thead>
    <tr>
      <th style="text-align: right">λ</th>
      <th style="text-align: right">Return</th>
      <th style="text-align: right">VaR(95%)</th>
      <th style="text-align: right">Concentration</th>
    </tr>
  </thead>
  <tbody>
    <tr>
      <td style="text-align: right">0.0</td>
      <td style="text-align: right">7.79</td>
      <td style="text-align: right">9.64</td>
      <td style="text-align: right">53%</td>
    </tr>
    <tr>
      <td style="text-align: right">0.1</td>
      <td style="text-align: right">8.04</td>
      <td style="text-align: right">9.84</td>
      <td style="text-align: right">64%</td>
    </tr>
    <tr>
      <td style="text-align: right">0.5</td>
      <td style="text-align: right">7.06</td>
      <td style="text-align: right">8.81</td>
      <td style="text-align: right">45%</td>
    </tr>
    <tr>
      <td style="text-align: right">1.0</td>
      <td style="text-align: right">6.98</td>
      <td style="text-align: right">8.67</td>
      <td style="text-align: right">47%</td>
    </tr>
    <tr>
      <td style="text-align: right">2.0</td>
      <td style="text-align: right">3.31</td>
      <td style="text-align: right">5.50</td>
      <td style="text-align: right">17%</td>
    </tr>
  </tbody>
</table>

<hr />

<h2 id="1-value-as-the-entry-point">1. Value as the entry point</h2>
<p>A bet has value when the modelled probability exceeds the implied probability of the market price.<br />
For Matchday 12, seven bets meet this criterion and form the <strong>initial opportunity set</strong>.</p>

<table>
  <thead>
    <tr>
      <th style="text-align: right">MD</th>
      <th>Home</th>
      <th>Away</th>
      <th>Outcome</th>
      <th>Odds</th>
      <th>p(model)</th>
      <th style="text-align: right">EV/unit</th>
    </tr>
  </thead>
  <tbody>
    <tr>
      <td style="text-align: right">12</td>
      <td>Union Berlin</td>
      <td>Heidenheim</td>
      <td>2</td>
      <td>5.40</td>
      <td>0.292</td>
      <td style="text-align: right">0.5768</td>
    </tr>
    <tr>
      <td style="text-align: right">12</td>
      <td>Leverkusen</td>
      <td>Dortmund</td>
      <td>1</td>
      <td>2.55</td>
      <td>0.410</td>
      <td style="text-align: right">0.0455</td>
    </tr>
    <tr>
      <td style="text-align: right">12</td>
      <td>Hamburger SV</td>
      <td>Stuttgart</td>
      <td>2</td>
      <td>2.20</td>
      <td>0.507</td>
      <td style="text-align: right">0.1154</td>
    </tr>
    <tr>
      <td style="text-align: right">12</td>
      <td>Freiburg</td>
      <td>Mainz</td>
      <td>2</td>
      <td>4.10</td>
      <td>0.346</td>
      <td style="text-align: right">0.4186</td>
    </tr>
    <tr>
      <td style="text-align: right">12</td>
      <td>Werder Bremen</td>
      <td>Köln</td>
      <td>1</td>
      <td>2.25</td>
      <td>0.490</td>
      <td style="text-align: right">0.1025</td>
    </tr>
    <tr>
      <td style="text-align: right">12</td>
      <td>Hoffenheim</td>
      <td>Augsburg</td>
      <td>X</td>
      <td>4.00</td>
      <td>0.256</td>
      <td style="text-align: right">0.0240</td>
    </tr>
    <tr>
      <td style="text-align: right">12</td>
      <td>Hoffenheim</td>
      <td>Augsburg</td>
      <td>2</td>
      <td>4.35</td>
      <td>0.450</td>
      <td style="text-align: right">0.9575</td>
    </tr>
  </tbody>
</table>

<p>A few points stand out:</p>

<ul>
  <li><strong>Magnitude varies significantly:</strong> from marginal opportunities (EV ≈ 0.02) to strong mispricings such as Hoffenheim–Augsburg (2) with <strong>EV ≈ 0.96</strong>.</li>
  <li><strong>Value is not a stake signal:</strong> it identifies <em>which bets merit further analysis</em>, not how much to allocate.</li>
  <li>The true decision happens on the <strong>portfolio level</strong>, after diversification and risk are considered.</li>
</ul>

<hr />

<h2 id="2-strategies-and-the-efficient-frontier">2. Strategies and the efficient frontier</h2>
<p>The following visualisation shows how different strategies behave in the return–risk space:</p>

<p><img src="/assets/img/EffizientesPortfolio.png" alt="Efficient Portfolio" /></p>

<ul>
  <li><strong>Equal Weight</strong>: wide, uncontrolled dispersion.</li>
  <li><strong>Min Risk</strong>: narrow, well-defined downside limits.</li>
  <li><strong>Max Return</strong>: strong return potential but extremely concentrated exposure.</li>
  <li><strong>Optimised λ-portfolios</strong>: balanced, risk-aware, and efficient.</li>
</ul>

<p>The plot conveys more insight than paragraphs of text — it makes efficiency visible.</p>

<hr />

<h2 id="3-how-strategies-actually-allocate-capital">3. How strategies actually allocate capital</h2>
<p>The allocation view illustrates the logic of each strategy:</p>

<p><img src="/assets/img/StrategienWetteinsatz.png" alt="Strategy Stakes" /></p>

<ul>
  <li>Equal Weight distributes capital arbitrarily.</li>
  <li>Min Risk stabilises exposures through diversification.</li>
  <li>Max Return concentrates heavily on the highest EV bet.</li>
  <li>λ-portfolios balance return and diversification in line with risk preferences.</li>
</ul>

<p>The benefit: <strong>misallocations appear visually, not retrospectively.</strong></p>

<hr />

<h2 id="4-comparing-pl-distributions">4. Comparing P&amp;L distributions</h2>
<p>The shape of each P&amp;L distribution explains the strategy’s behaviour:</p>

<p><img src="/assets/img/PnLVergleich.png" alt="P&amp;L Comparison" /></p>

<ul>
  <li>Equal Weight: broad and unstructured.</li>
  <li>Min Risk: calm, tight, predictable.</li>
  <li>Max Return: volatile with wide swings.</li>
  <li>λ-portfolios: controlled transitions between the extremes.</li>
</ul>

<p>Interpretation is guided by the chart, not assumptions.</p>

<hr />

<h2 id="5-which-bet-contributes-which-risk">5. Which bet contributes which risk?</h2>
<p>Loss contributions show where risk originates:</p>

<p><img src="/assets/img/PnLDrilldown.png" alt="P&amp;L Drilldown" /></p>

<ul>
  <li>Risk becomes attributable to individual bets.</li>
  <li>Dominant loss drivers stand out clearly.</li>
  <li>Portfolio decisions gain transparency and justification.</li>
</ul>

<p>Risk management becomes explicit instead of conceptual.</p>

<hr />

<h2 id="conclusion">Conclusion</h2>
<p>Quantitative betting relies on <strong>structure</strong>, <strong>model-driven logic</strong>, and <strong>visual clarity</strong>:</p>

<ul>
  <li>Value identifies opportunities — not stakes.</li>
  <li>Portfolios replace individual bets.</li>
  <li>Risk becomes visible <em>before</em> it materialises.</li>
  <li>Visualisations carry most of the insight; the text simply provides context.</li>
</ul>

<p>This approach shifts decision-making from intuition to robust analytical judgement.</p>

<hr />

<p>Tags:  <a href="/tags/risk/">risk</a>,   <a href="/tags/portfolio-thinking/">portfolio-thinking</a>,   <a href="/tags/exposure-management/">exposure-management</a>,   <a href="/tags/capital-management/">capital-management</a>  </p>]]></content><author><name>Bernhard von Boyen</name></author><category term="risk" /><category term="portfolio-thinking" /><category term="exposure-management" /><category term="capital-management" /><summary type="html"><![CDATA[How a quantitative bettor evaluates Matchday 12: value signals, portfolio construction and risk profiling — clear, transparent and data-driven.]]></summary></entry></feed>